Waddah Attar Visual MF RSI
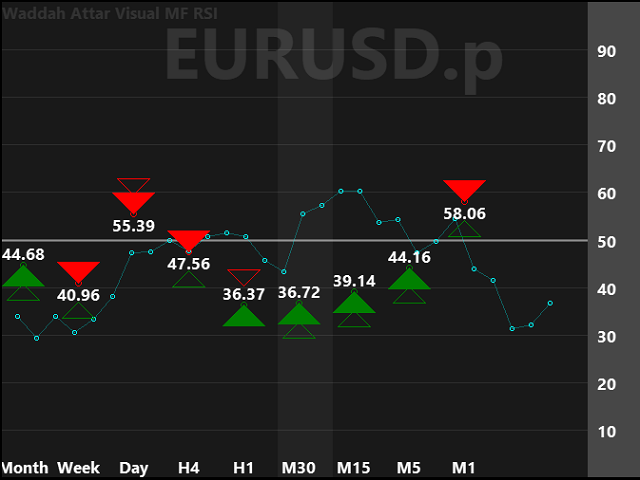
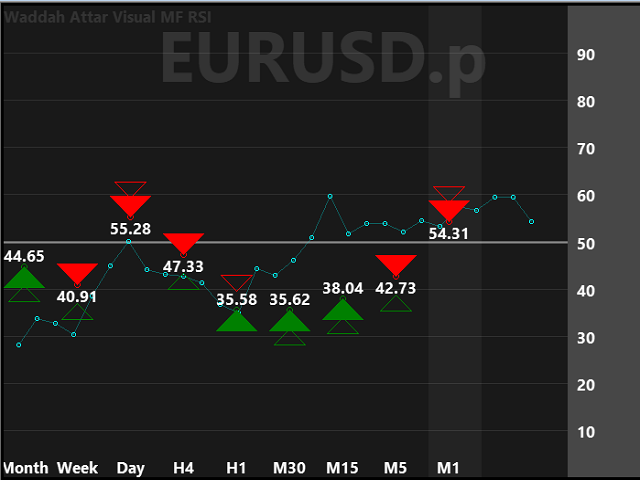
this App show you RSI values and status for all frames in one chart .
Filled Triangle means current RSI Value .
Framed Triangle means previous RSI Value .
Up Arrow and Green Color means the direction of RSI is up .
Down Arrow and Red Color means the direction of RSI is down .
when you move mouse cursor on frame column .. the full RSI chart will drawn .
you can change RSI Period in the app properties .. the default is 14 .
thanks and good luck .