 Graph configuration and buy and sell signals based on Stormer's (Alexandre Wolwacz, Brazilian trader) swing, position and day trade strategy, described on his youtube channel (https://www.youtube.com/watch?v= 0QZ_NjWkwl0)
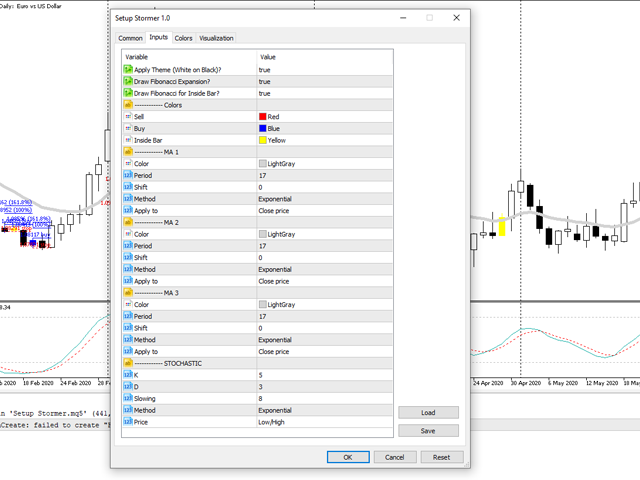
The buy and sell indications are based on 2 candle patterns ( Inside Bar [Yellow] and Reversal Closing Price [Blue and Red] ), 3 Moving Averages and 1 Stochastic .
Indicators:
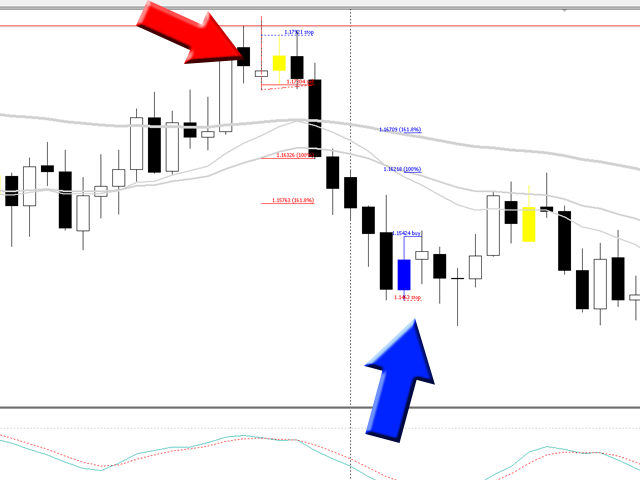
- Inside Bar - Candle pattern indicating trend continuity, or reversal
- Reversal Closing Price - Candlestick pattern indicating trend reversal
- Moving Averages - Used to determine the price trend
- Stochastic - Used to check the states where the market sold or bought more than it should, and therefore there is the possibility of creating tops and bottoms
How to use:
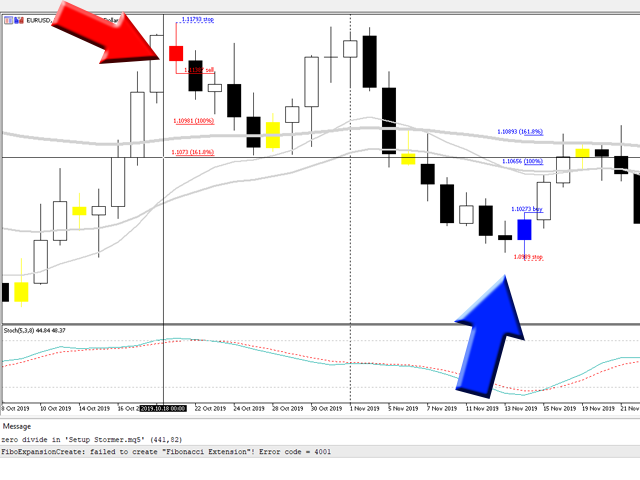
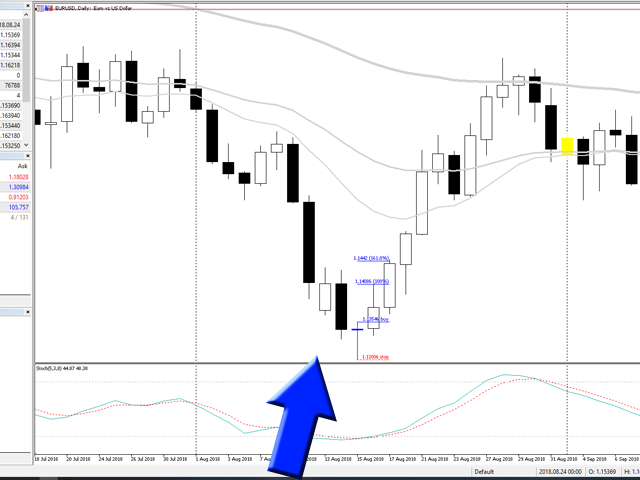
When there is an opportunity to buy or sell, the indicator will show a Fibonacci Expansion containing the following values:
- buy/sell - Recommended entry value of a trade
- stop - Recommended value for placing the operation stop
- 100% - Value of the objective to partially carry out the operation. At this moment, you can move the stop of the operation to guarantee the profit
- 161.8% - Operation profit target value
IMPORTANT! The operation can only be entered up to 2 candles after the SIGNAL is displayed.
Ex . If the input signal was an Inside Bar [Yellow], enter the candle only after the Inside bar or the Next Candle. If the entry signal was on a reversal candle [Red, Blue], enter only the candle after the reversal candle or the next candle.