Introduced by “John Carter”, the squeeze indicator for MT5 represents a volatility-based tool. Regardless, we can also consider the squeeze indicator as a momentum indicator, as many traders use it to identify the direction and strength of price moves. In fact, this squeeze indicator shows when a financial instrument is willing to change from a trending market to another that trades in a considerably tight range, and vice versa. Moreover, it indicates promising entries as well as exit points
For better view (add bollinger band and Keltner channel), use this indicator with addition free version at here . Detail document here .
How does it work?
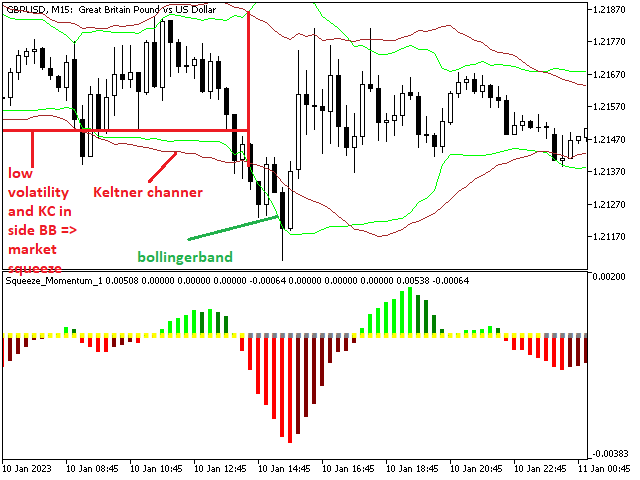
The first two indicators are the Bollinger Band and the Keltner channel . Which are responsible for triggering the first component of the MT5 squeeze indicator “the dots”. Hence, at this point, two cases may occur depending on the movement of both indicators (img1)
The dots
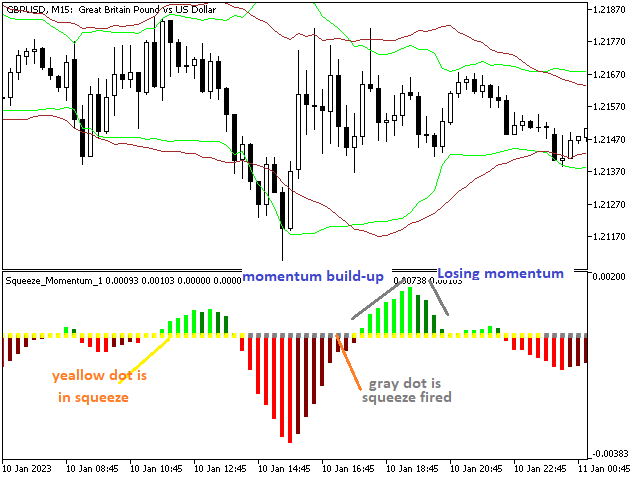
Dot appeare at level 0 with gray where Keltner channel inside Bollinger band and yeallow when Keltner channel outside Bollinger band
The histogram
The histogram shows momentum of price.
Squeeze settings
Actually, most traders use the default parameters of the squeeze indicator. Nonetheless, setting up this indicator does not require advanced knowledge. That is why we can easily modify it to fit our needs. The image below displays what will be plotted on the chart if we use the default inputs. Yet, we can customize the MT5 squeeze by adjusting its different variables like;
-BB length (period): represents the number of bars you want to use when calculating the squeeze indicator.
-BB multiple factor (deviation): represents the standard deviation of the indicator.
-Keltner length (period): denotes the number of bars you want to use to calculate the indicator.
-KC multiple factor (deviation): represents the standard deviation of the indicator.
-User True rangce (KC): when true, KC user range of price; when false, KC use high-low in before 1 candle
How to trade with the squeeze indicator (img2)
• Dots change color + after that Rising Momentum above the 0-line = Buy Signal
• Dots change color + after that Declining Momentum below the 0-line = Sell Signal
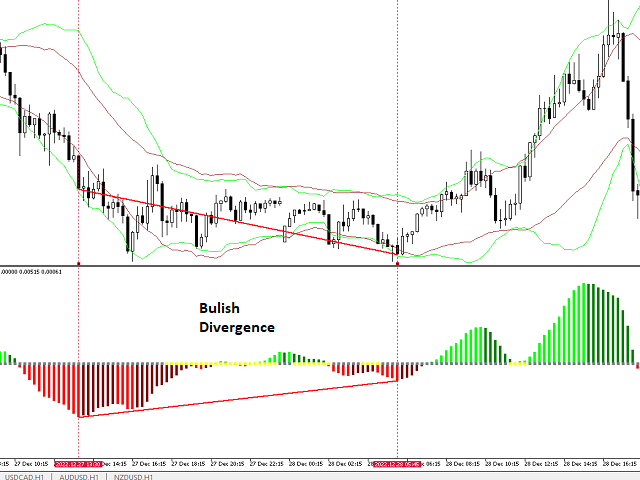
Trade when divergence with histogram and price (img3)