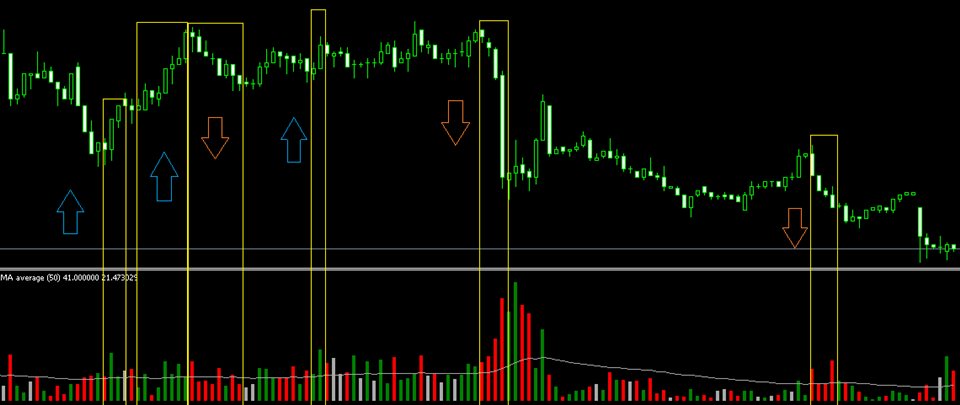
This indicator is directly related to the flow of negotiations. In Graphical Analysis, traders look at the bars below the charts, called “volume bars”. They demonstrate how many shares were traded per period (days, weeks, months, according to the chart's timeframe), in addition to illustrating the average market volume trend. If the average volume tends to increase, it is a sign of price variation. The colors identify whether the purchase volume is greater (green) or whether the sales volume (red) is greater. If the color is different from red or green, it means the market is divided between buying and selling