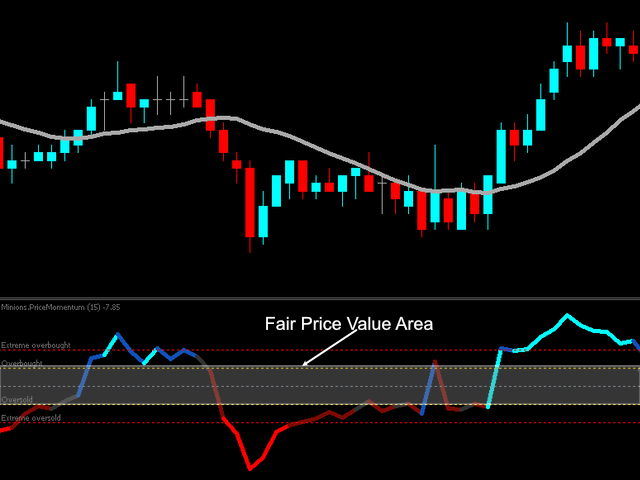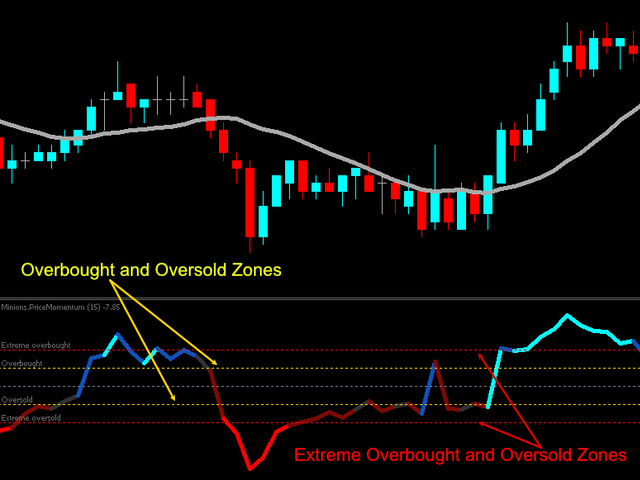
Value Chart indicator presents the Price evolution in a new form. This indicator, Price Momentum , was developed taking all the calculations presented in the book " Dynamic Trading Indicators " by Mark W. Helweg and David Stendahl (2002). The technique involves de-trended Prices from a user-defined Period of analysis and the addition of a Volatility index correction. The result is an Oscillator with 3 zones: Fair Price Value, Overbought/Oversold and Extremely Overbought/Oversold zones.
Adding this indicator to your Price Action analysis and/or in conjunction with other market analysis will bring you more chances of success in your trades.
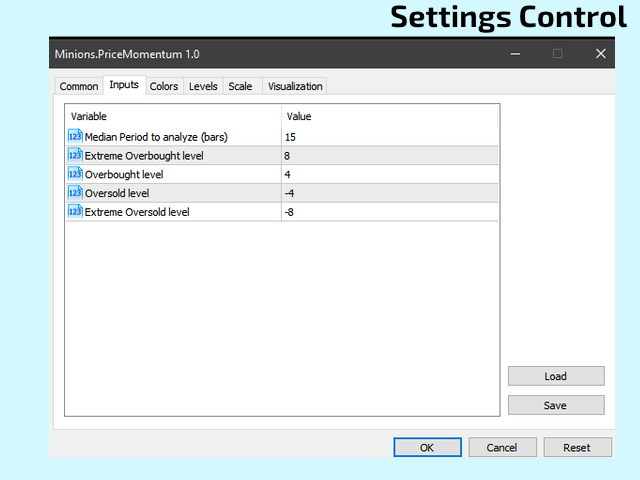
SETTINGS
- Period to analyze
- Extreme Overbought level
- Overbought level
- Oversold Level
- Extreme Oversold Level
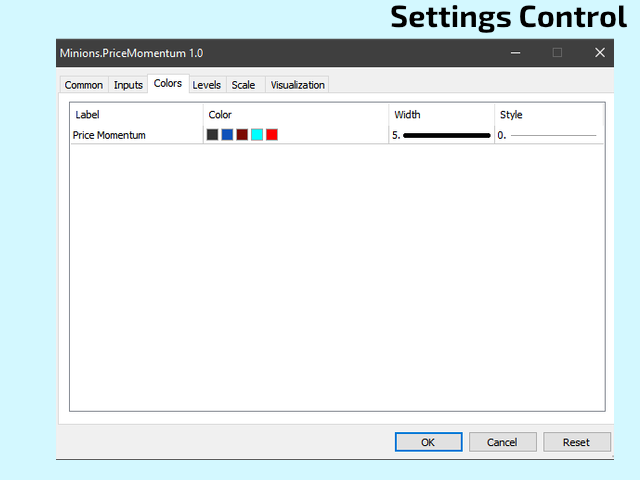
- Colors of all Levels
- Moving average Period over the Price Momentum index
As always, if you like this indicator, all I am asking is a little Review (not a Comment, but a REVIEW! )...
This will mean A LOT to me... And this way I can continue to give away Cool Stuff for Free...
With No Strings Attached! Ever!
Live Long and Prosper!
;)