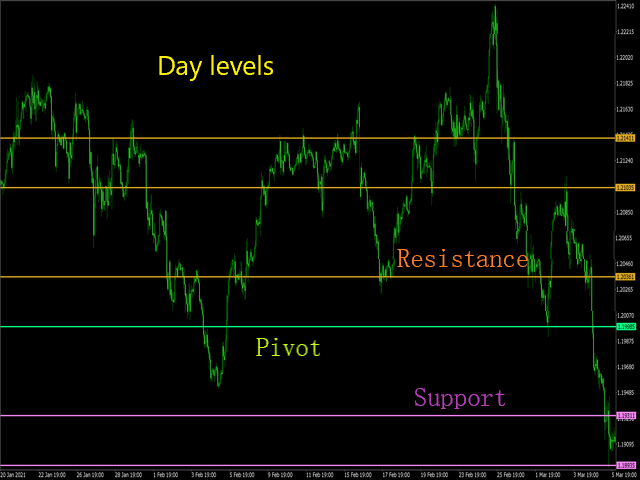
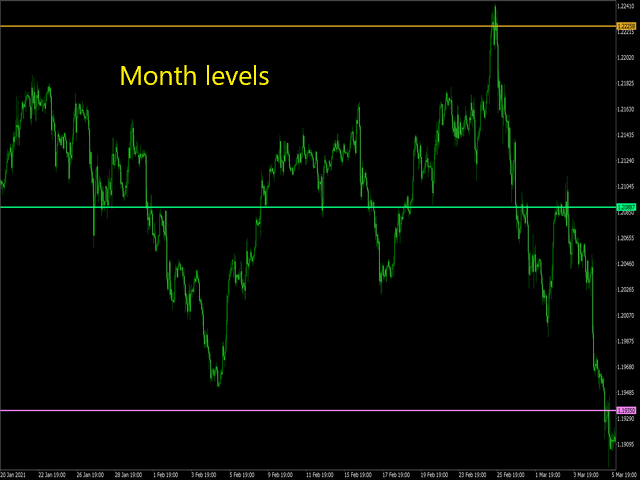
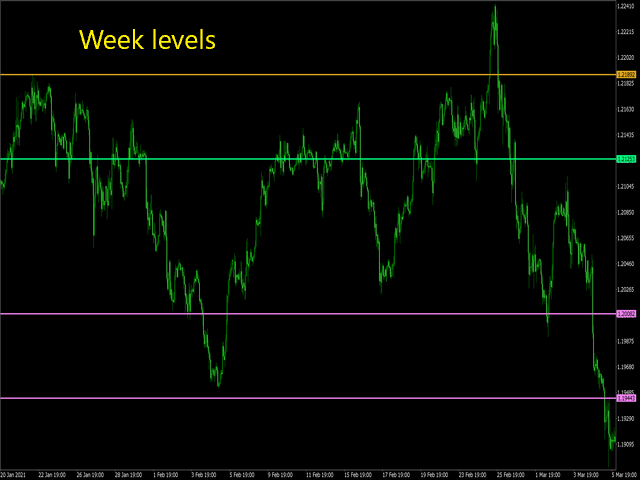
 The utility draws pivot levels based on a selection from
- day
- week
- month
The previous candlestick of the selected timeframe is taken and the values for the levels are calculated using the following formulas:
Pivot = (high + close + low) / 3
R1 = (2 * Pivot) - low
S1 = (2 * Pivot) - high
R2 = Pivot + (R1 -S1)
R3 = high + (2 * (Pivot - low))
S2 = Pivot - (R1 - S1)
S3 = low - (2 * (high - Pivot));
The style and thickness for all lines are adjusted.
The colors for the R, Pivot and S lines are adjusted separately.
When the utility is removed from the chart, the lines are removed.
There is also such a utility https://www.mql5.com/en/market/product/63805
It gives you more options.