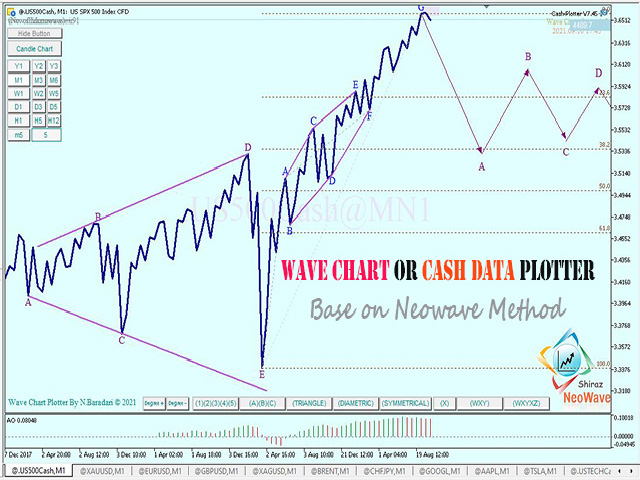
This Expert Advisor is applicable to plot wave charts as per the NeoWave method (Neely Extension of Wave Theory). NeoWave is a scientific, objective and revolutionary style of Elliott Wave Theory that was invented by Glenn Neely in 1990 in the “Mastering Elliott Wave” book.
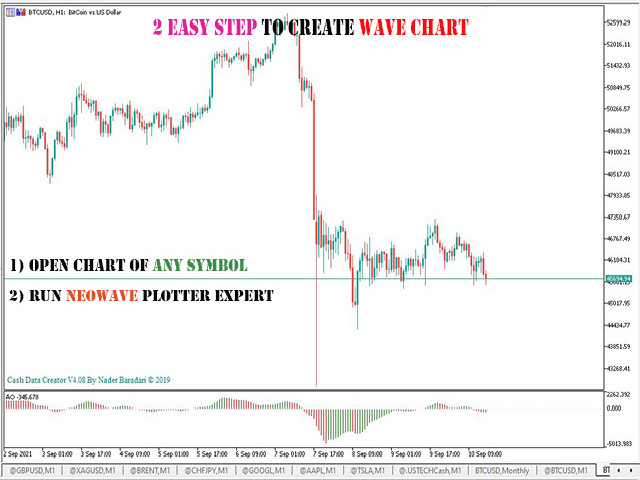
To start analyzing with this method, we need a particular chart called the Wave Chart or Cash Data chart . This is the first step for a good wave analysis. To draw this chart, Highs and Lows should be plotted in the order that they occurred. This could be a very challenging and time-consuming task to do for any symbol on any Timeframe.
This Expert Adviser can plot Wave Charts for any Symbol on any Timeframe automatically and in real-time. For More details watch this video: https://youtu.be/AND5tfyxIdU
Important : This Expert advisor does not work on Demo version. Because Demo version just work on Strategy-Tester mode.
Some features of this Expert Adviser are:
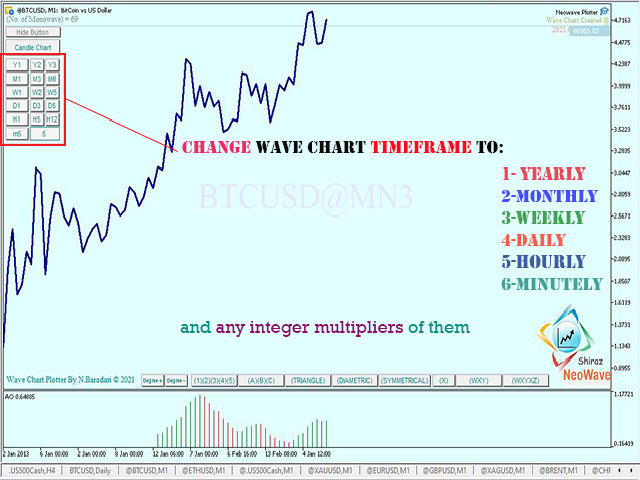
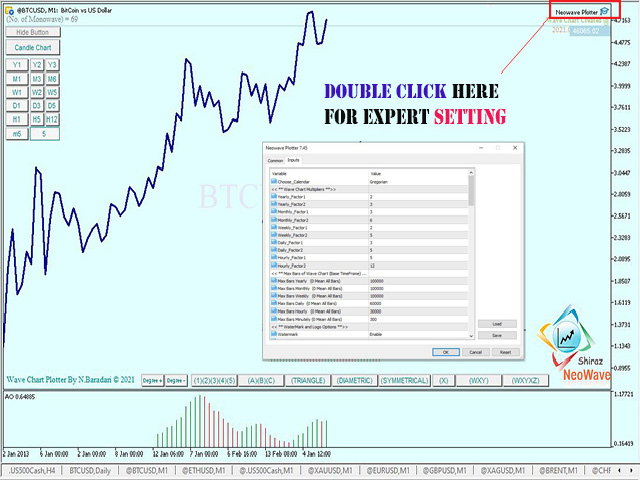
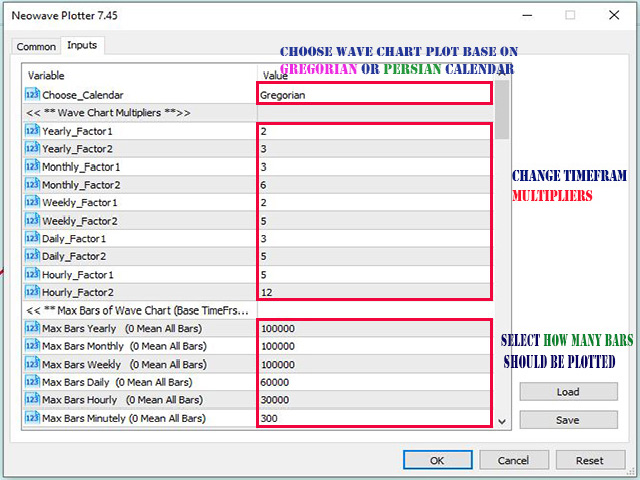
- Draw Wave Chart on yearly , monthly , weekly , daily , hourly and minutely timeframes
- Draw Wave Chart on any integer multiples of above timeframes
- Possibility of plotting Wave Chart on Gregorian and Solar calendars
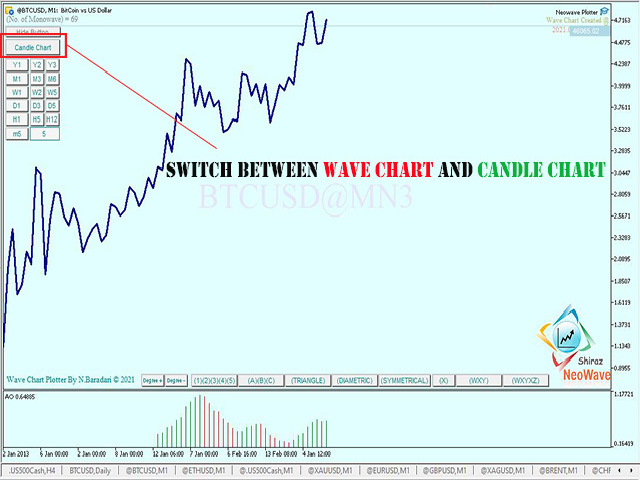
- Switch between Wave Chart and Candlestick Chart simultaneously
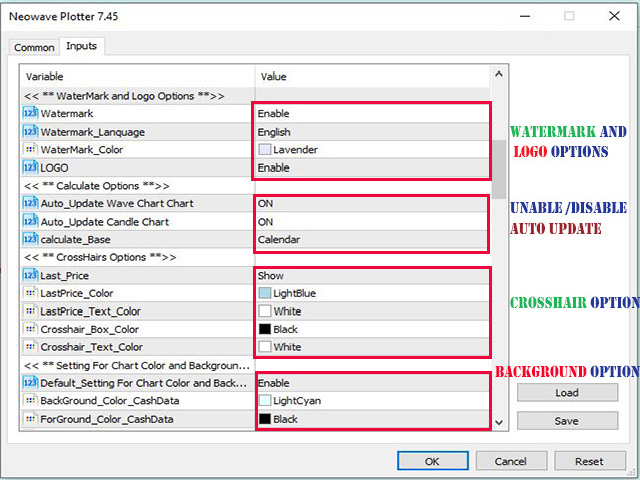
- Online auto updating Wave Charts
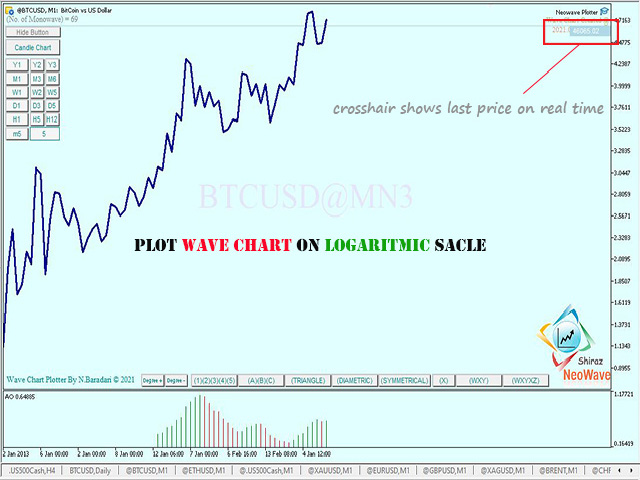
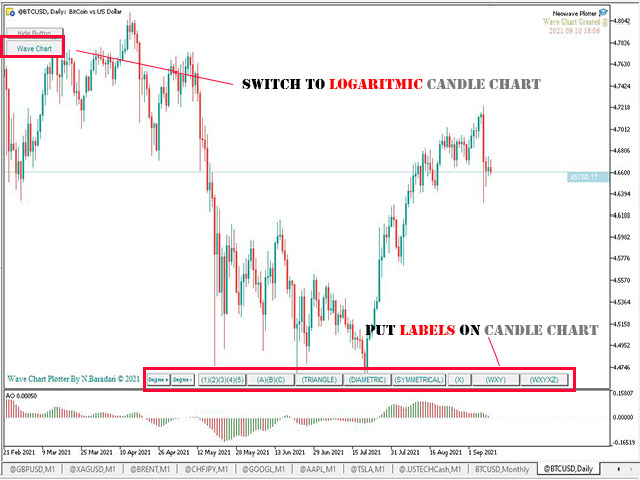
- Draw Wave Chart and Candle Chart on logarithmic scales
- Calculate Fibonacci ratio on Logarithmic scale
- Last price crosshair and current price crosshair tools
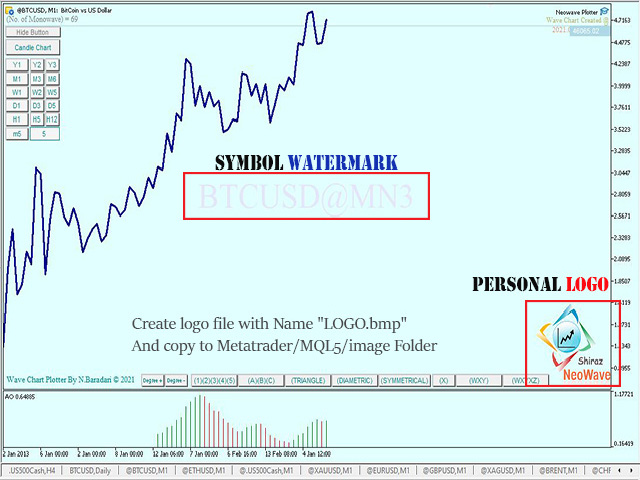
- Possibility of putting watermarks and logos
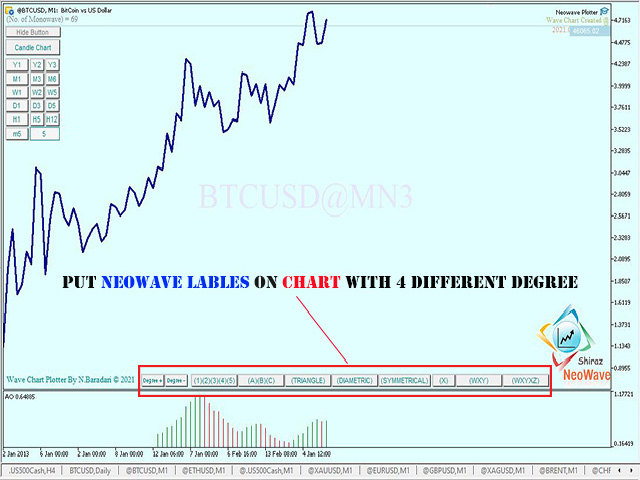
- Possibility of putting pattern labels such as impulsive , zigzag , flat , triangle , diametric , symmetrical and etc. for different degrees
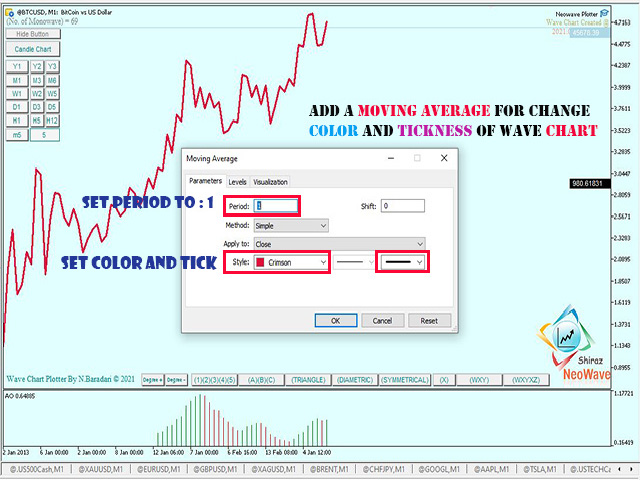
- Customizable labels by color and size
- Put individual Labels on each timeframe
- Save wave analysis on each timeframe automatically
- Take picture of your analysis and make a personal archive