MT5 version - https://www.mql5.com/en/market/product/70786
Attention ! For correct work you need to download data for all instruments in all timeframes!
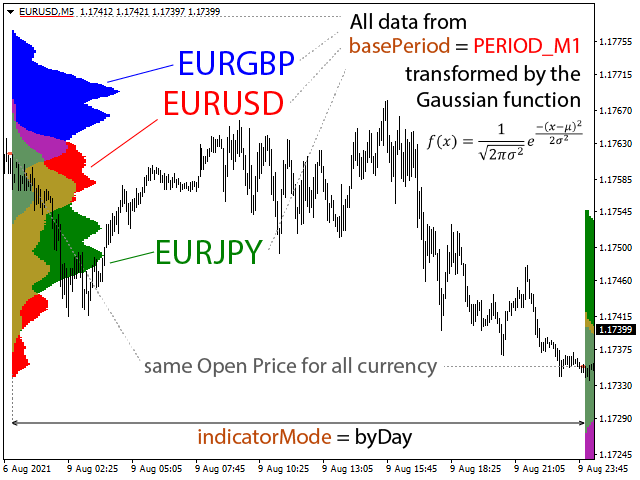
The ability to display multiple currency pairs.
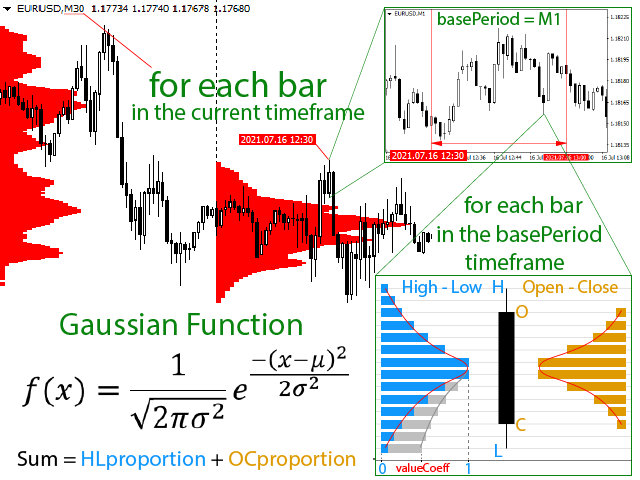
The a bility to display data from smaller timeframes on the current chart. For example, displaying data from the M1 period on the H1 chart.
Calculation of values using the Gaussian f unction (normal distribution formula).
Flexible system of settings.
Settings :
symbol 1 – The Name of the instrument. If empty or equal to "0", then it is ignored.
basePeriod - base period.
numberOfIntervals - number of intervals.
indicatorMode - display mode. Sets the value of each interval: by4h (4 hours), by6h (6 hours), etc. Mode byDeep - the interval is equal to the number of analyseDeep bars.
zoomCoeff - allows you to compress/expand the display of the indicator.
formulaType - calculation formula. Gaussian formula ( _gaussianFunction ) or √x ( _sqrt ) function.
valueCoeff - the value (from 0 to 1) of the extreme point when calculating values for each bar level (see image 1).
HLproportion - the proportion HL (High-Low) value in the total value for each bar level. The inequality HLproportion + OCproportion <= 1 must be observed.
OCproportion - the proportion OC (Open-Close) value in the total value for each bar level. The inequality HLproportion + OCproportion <= 1 must be observed.
smoothingDeep - smoothing depth.
lineColor - color.
uniquePrefix - unique prefix.
analyseDeep - analysis depth when indicatorMode = byDeep
showOpenPrice — show the O pen P rice.
showOpenPriceColor —the color of the O pen P rice.
showClosePrice —show the Close P rice.
showClosePriceColorSym1 — close price color for symbol1.