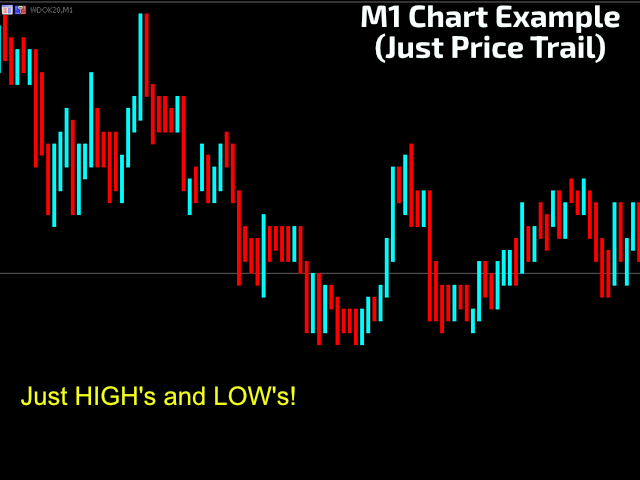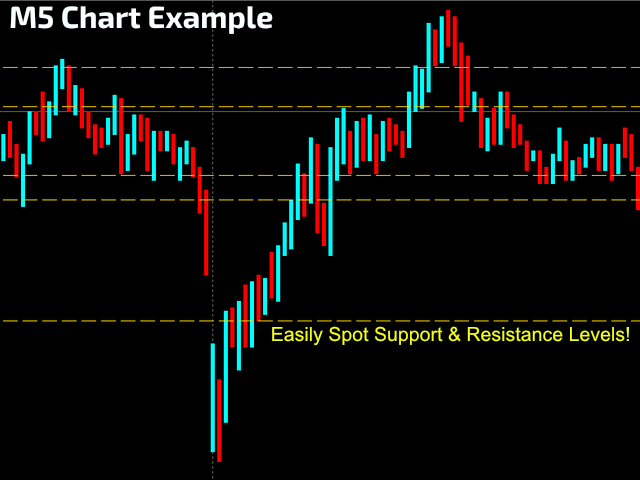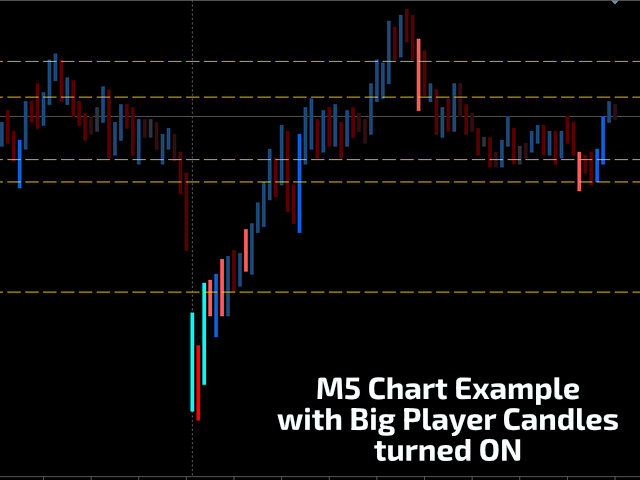
For those who hate candlesticks in lower timeframes (M1 through M15) we "invented" a clean new way to follow Price movement and displacement (volatility) called Price Trail Chart . The big "secret" is to get rid of those annoying candle wicks and draw the whole complete candle without them, this way we get a cleaner chart and a new view of the Price Path. No Open or Close markings, just LOW's and HIGH's, full body candle.
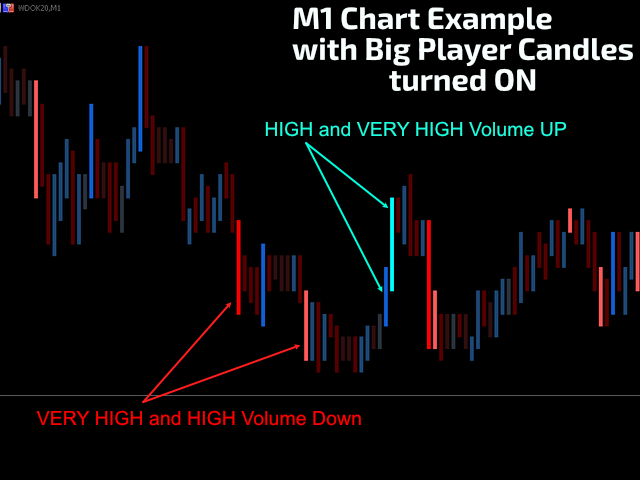
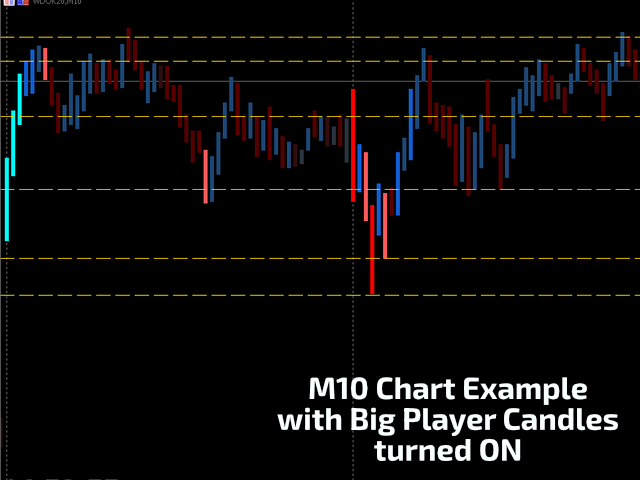
Additionaly we inserted a Volume monitor from our Best Downloaded indicator called Big Player Candles , painting with colors you choose the different volumes happening at each candlestick.
Give it a try, you may get surprised with a calm new way of looking at a Price Chart: just the Price Trail !
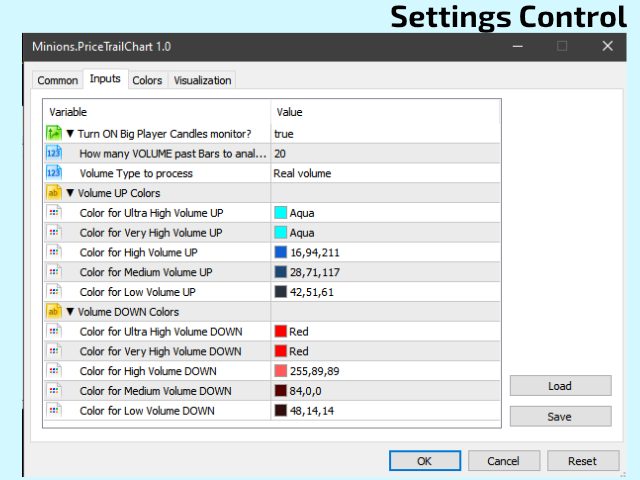
SETTINGS
- Ability to turn ON/OFF the Big Player Candles monitor.
- Volume Period (bars) to analyze.
- Volume Type to process: Real Volue / Tick Volume
- 5 colors for UP movement: Low, Medium, High and Ultra High.
- 5 colors for DOWN movement: Low, Medium, High and Ultra High.
As always, if you like this indicator, all I am asking is a little Review (not a Comment, but a REVIEW! )...
This will mean A LOT to me... And this way I can continue to give away Cool Stuff for Free...
With No Strings Attached! Ever!
Live Long and Prosper!
;)