Parameters
Lot 0.1 to 0.3
NZDJPY H1 symbol
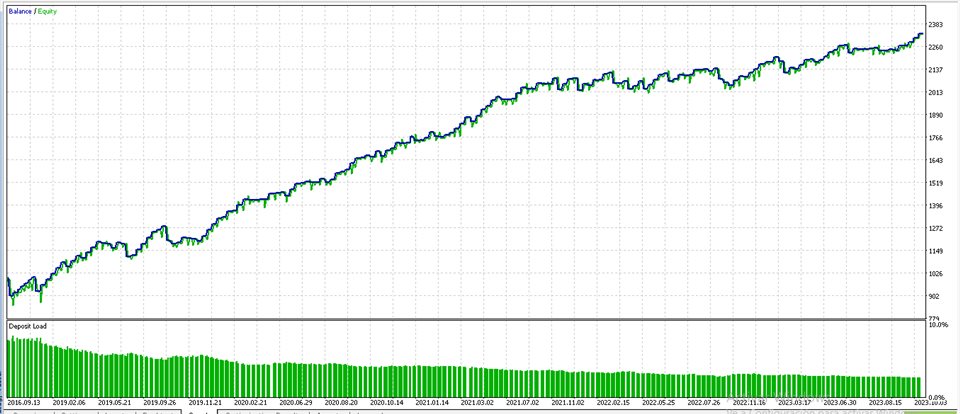
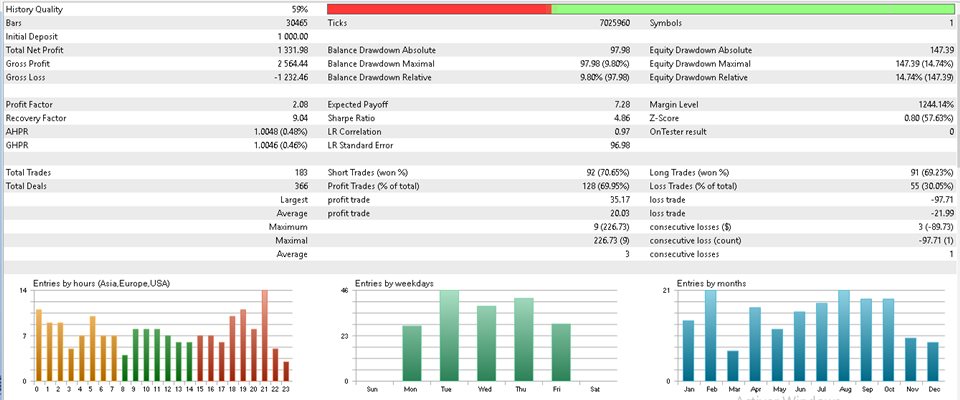
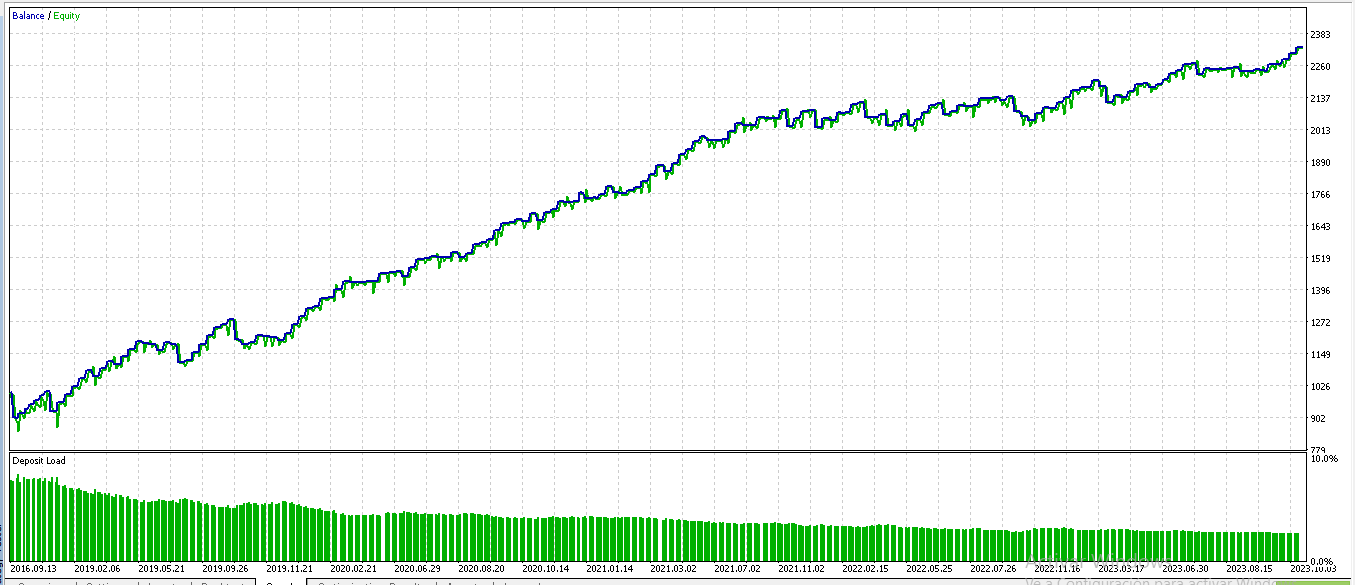
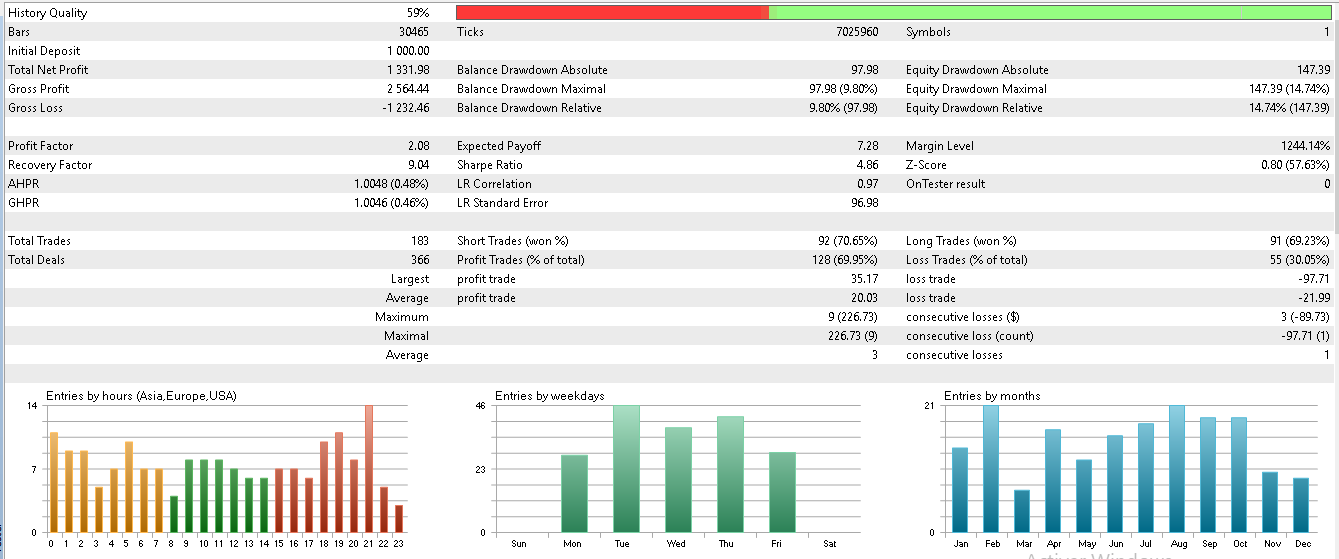
Deposit 1000
Leverage 1 to 100
Advice to work with a broker with a low spread
Always have good Money Management.
The EA works with CCI and Stochastics.
CCI Indicator:
1. **Measures volatility:** The CCI is used to measure market volatility. This means it can help traders determine when a market is overbought or oversold, which can be helpful in making buy or sell decisions.
2. **Swinging Indicator:** The CCI oscillates around a baseline, usually in the range of -100 to +100. Values above +100 indicate that an asset may be overbought, while values below -100 suggest that it could be oversold.
3. **Identification of divergences:** Traders use the CCI to look for divergences between the indicator and the underlying price. Divergences can be signals of changes in price direction.
4. **Potential Turning Points:** The CCI is often used to identify potential turning points in the market. When the CCI crosses the baseline from above, it can be considered a sell signal, and when it crosses the baseline from below, it can be considered a buy signal.
5. **Usable on different time frames:** The CCI can be applied on different time frames, making it useful for both short-term and long-term traders.
6. **Adaptability:** Traders can adjust the CCI calculation period according to their needs. Shorter values result in an indicator more sensitive to price fluctuations, while longer values smooth out the indicator.
7. **Complementary Tool:** The CCI is often used in conjunction with other indicators and technical analysis to make more informed trading decisions.
Stochastic Indicator:
1. **Momentum Oscillator:** The stochastic is a momentum oscillator that compares the current closing price of an asset with its price range over a specific time period. This provides information on the speed and momentum of the price movement.
2. **Limited Range:** Stochastic oscillates in a limited range from 0 to 100. Values above 80 are generally considered overbought, which may suggest that the asset is ripe for a possible bearish reversal. Values below 20 are generally considered oversold, which may suggest that the asset is ripe for a possible upward reversal.
3. **Divergences:** Like the CCI, the stochastic is used to identify divergences between the indicator and the underlying price, which can be a signal of change in price direction.
4. **Two lines:** The stochastic is made up of two lines, %K and %D. The %K line is the fastest and %D is a smoothed version of %K. The intersections and divergences between these two lines are often used as trading signals.
5. **Market Sensitivity:** Stochastic is sensitive to recent price action and can provide quick signals in markets experiencing wild swings.
6. **Usable on different time frames:** Like CCI, Stochastic can be applied on different time frames, making it suitable for both short-term and long-term traders.
7. **Complementary Tool:** Stochastic is commonly used in conjunction with other indicators and technical analysis to make more informed trading decisions.
8. **Identification of overbought and oversold zones:** The extreme values of the stochastic (above 80 and below 20) are used to identify overbought and oversold zones, which can indicate possible reversal points.