Introducing Candle Pattern Spotter: Your Ultimate Candlestick Pattern Analysis Tool
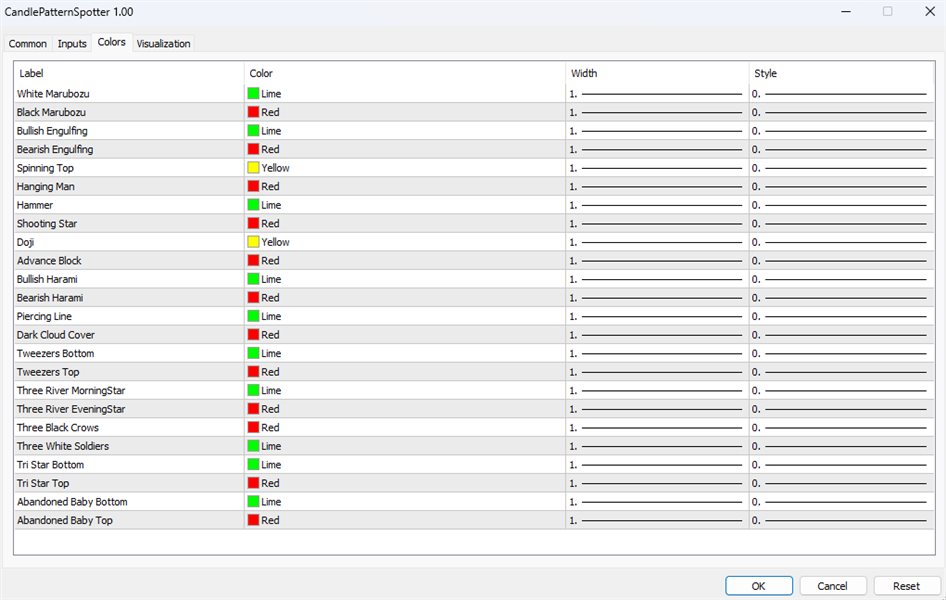
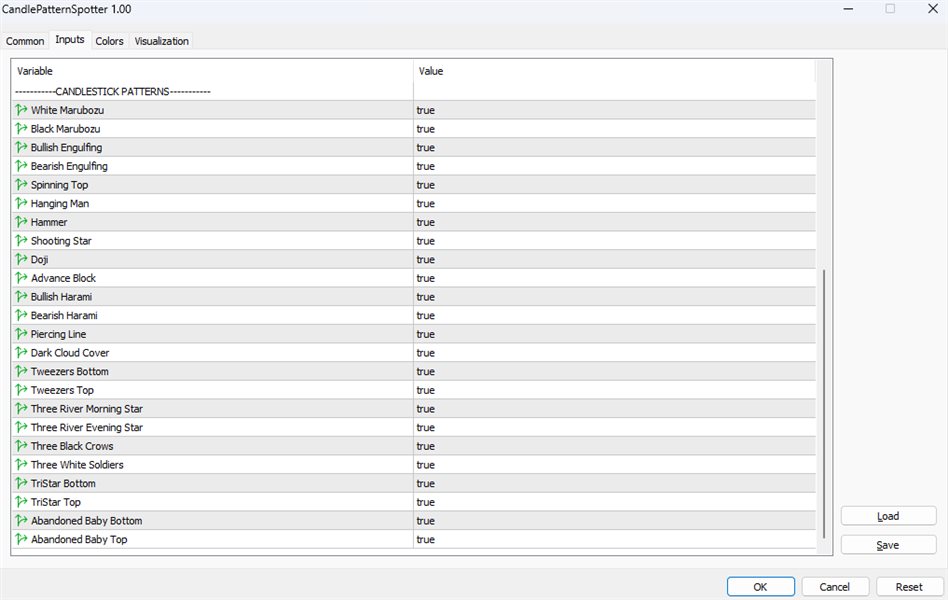
Are you tired of manually scanning through countless candlestick charts, trying to identify profitable trading opportunities? Look no further! Candle Pattern Spotter is here to revolutionize your trading experience. With its advanced features and cutting-edge technology, this powerful tool will help you spot and analyze 24 different candlestick patterns effortlessly.
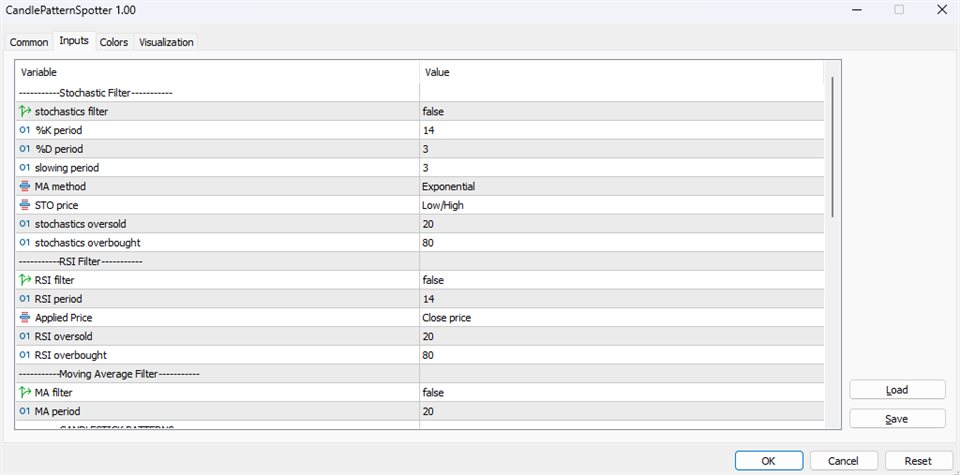
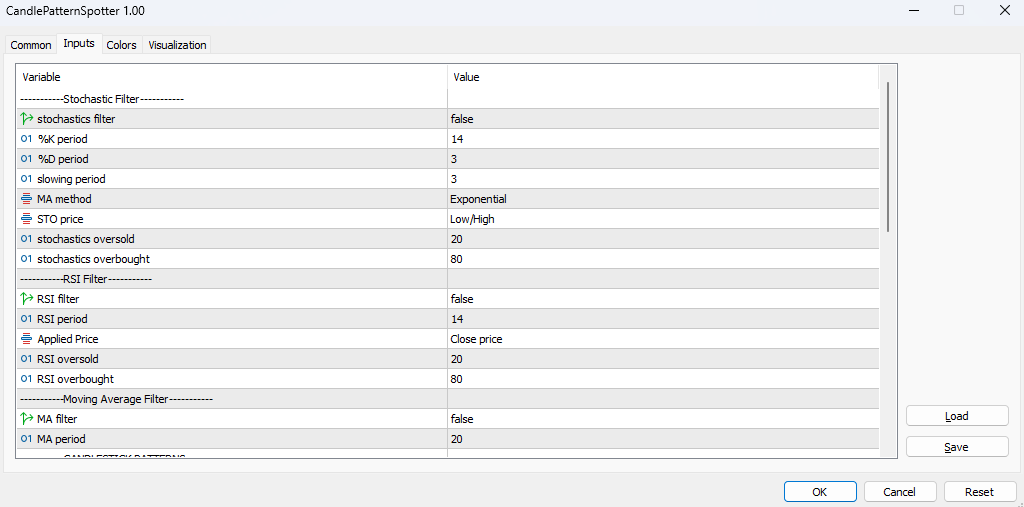
One of the standout features of Candle Pattern Spotter is its robust filtering capabilities. By integrating popular technical indicators such as RSI (Relative Strength Index), Stochastics, and Moving Average, this tool allows you to apply customized filters to your candlestick pattern analysis. This means you can refine your search and focus on the most relevant patterns that meet your specific trading strategy.
Let's dive into the impressive candlestick patterns that Candle Pattern Spotter can identify:
- Strong bullish signal indicating a bullish trend continuation.
- Characterized by a long white (or green) body with no upper or lower shadows.
- Strong bearish signal indicating a bearish trend continuation.
- Characterized by a long black (or red) body with no upper or lower shadows.
- Bullish reversal pattern formed by a small bearish candle followed by a larger bullish candle.
- The bullish candle completely engulfs the previous bearish candle.
- Bearish reversal pattern formed by a small bullish candle followed by a larger bearish candle.
- The bearish candle completely engulfs the previous bullish candle.
- Neutral pattern indicating indecision in the market.
- Characterized by a small body with upper and lower shadows of similar length.
- Bearish reversal pattern characterized by a small body and a long lower shadow.
- Typically occurs after an uptrend and signals a potential trend reversal.
- Bullish reversal pattern characterized by a small body and a long lower shadow.
- Typically occurs after a downtrend and signals a potential trend reversal.
- Bearish reversal pattern characterized by a small body and a long upper shadow.
- Typically occurs after an uptrend and signals a potential trend reversal.
- Pattern indicating market indecision, where the opening and closing prices are very close or identical.
- Can signal a potential trend reversal or continuation depending on the context.
- Bearish reversal pattern formed by three consecutive bullish candles with diminishing upward momentum.
- Suggests that the bullish trend is losing strength and a bearish reversal may occur.
- Bullish reversal pattern formed by a small bearish candle followed by a larger bullish candle.
- The bullish candle is contained within the range of the previous bearish candle.
- Bearish reversal pattern formed by a small bullish candle followed by a larger bearish candle.
- The bearish candle is contained within the range of the previous bullish candle.
- Bullish reversal pattern formed by a bearish candle followed by a larger bullish candle.
- The bullish candle opens below the previous bearish candle's low and closes above its midpoint.
- Bearish reversal pattern formed by a bullish candle followed by a larger bearish candle.
- The bearish candle opens above the previous bullish candle's high and closes below its midpoint.
- Bullish reversal pattern characterized by two or more candlesticks with equal or near-equal lows.
- Suggests a potential trend reversal from bearish to bullish.
- Bearish reversal pattern characterized by two or more candlesticks with equal or near-equal highs.
- Suggests a potential trend reversal from bullish to bearish.
- Bullish reversal pattern formed by three consecutive bearish candles followed by a larger bullish candle.
- The bullish candle gaps up and engulfs the previous three bearish candles.
- Bearish reversal pattern formed by three consecutive bullish candles followed by a larger bearish candle.
- The bearish candle gaps down and engulfs the previous three bullish candles.
- Bearish reversal pattern formed by three consecutive long bearish candles.
- Each candle opens within the previous candle's body and closes near its low.
- Bullish reversal pattern formed by three consecutive long bullish candles.
- Each candle opens within the previous candle's body and closes near its high.
- Bullish reversal pattern characterized by three doji candles in a row.
- Suggests a potential trend reversal from bearish to bullish.
- Bearish reversal pattern characterized by three doji candles in a row.
- Suggests a potential trend reversal from bullish to bearish.
- Bullish reversal pattern formed by a doji candle sandwiched between two larger candles.
- The doji candle gaps below the previous bearish candle and above the following bullish candle.
- Bearish reversal pattern formed by a doji candle sandwiched between two larger candles.
- The doji candle gaps above the previous bullish candle and below the following bearish candle.
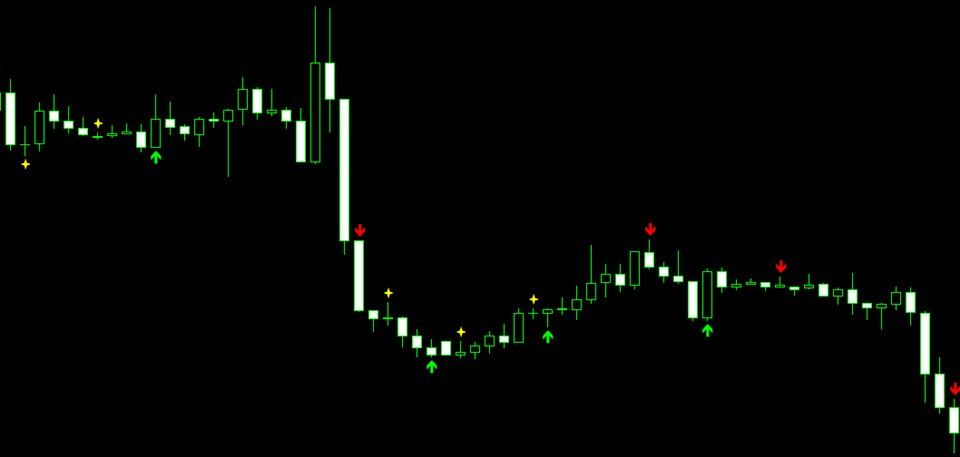
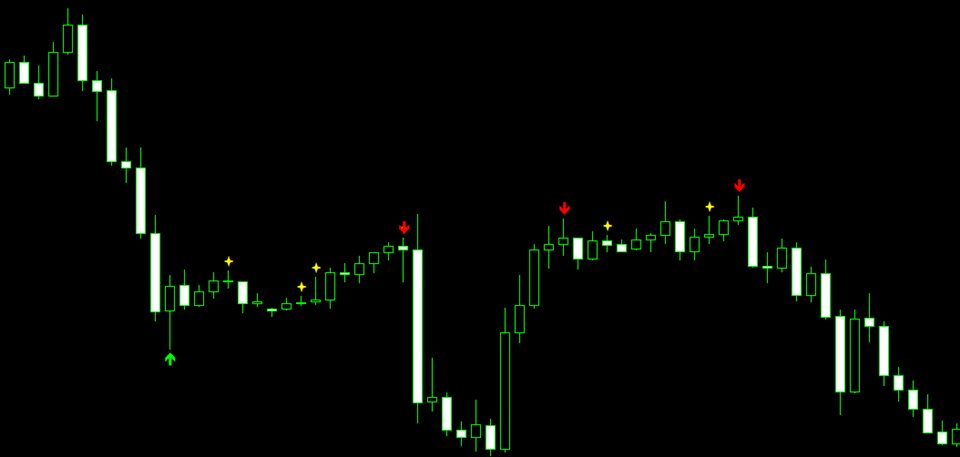
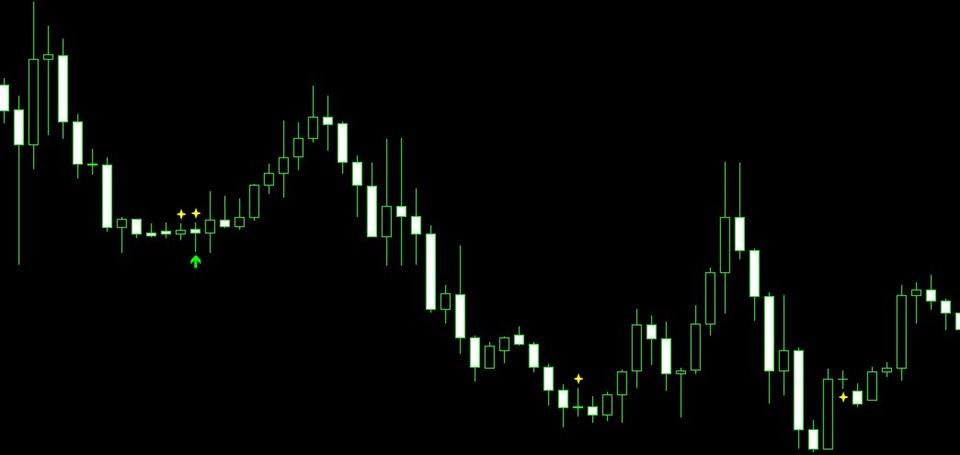
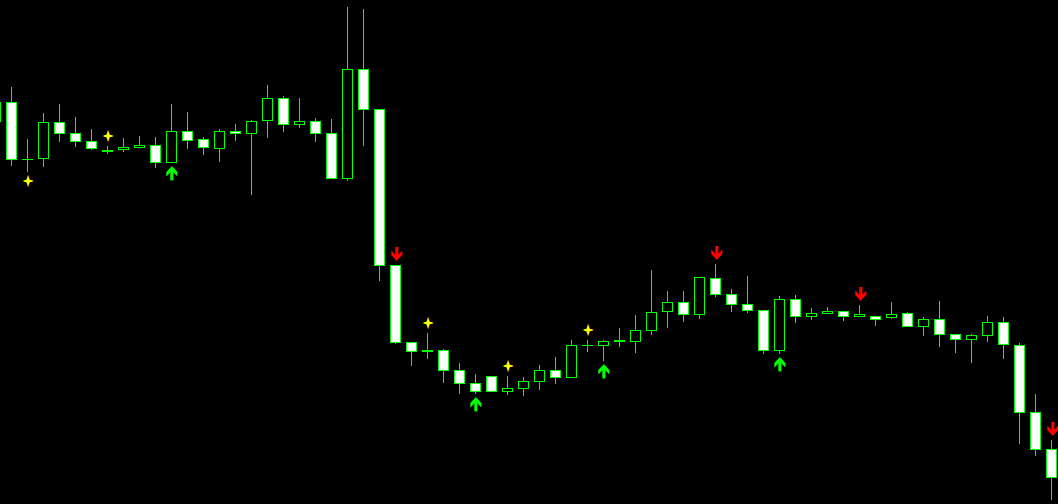
These patterns, when identified by Candle Pattern Spotter, provide valuable insights into potential market trends and reversals, helping traders make more informed decisions.
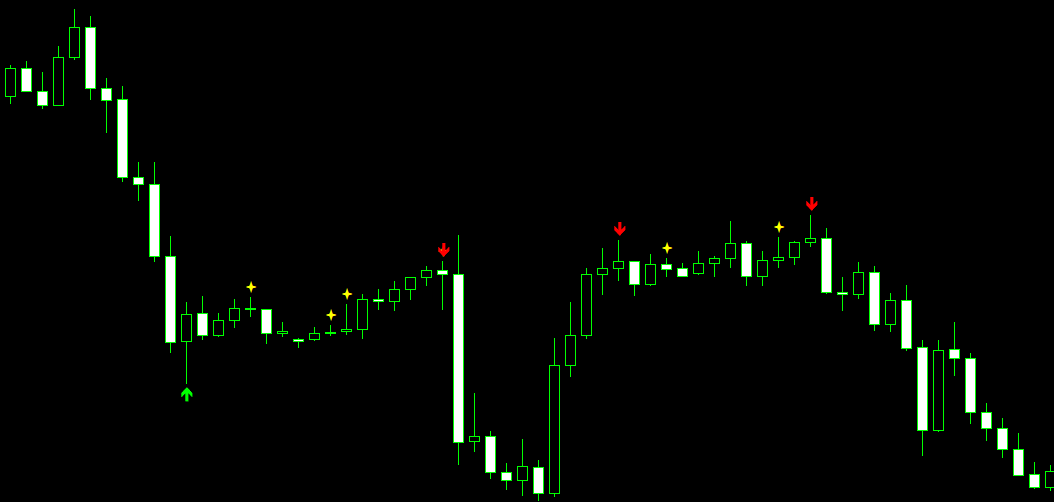
With Candle Pattern Spotter, you can save valuable time and make more informed trading decisions. The user-friendly interface provides clear visual representations of each identified pattern, along with detailed information and historical performance statistics. This allows you to quickly assess the reliability and profitability of each pattern before executing your trades.
Whether you are a seasoned trader or just starting your journey in the world of candlestick patterns, Candle Pattern Spotter is designed to cater to your needs. Its intuitive interface and powerful features make it accessible to traders of all levels of expertise. No more complex and confusing tools! Candle Pattern Spotter simplifies the process, allowing you to focus on what truly matters – making profitable trades.
Don't miss out on lucrative trading opportunities anymore. Embrace the power of Candle Pattern Spotter and take your trading to new heights. Start using this remarkable tool today and experience the thrill of trading like never before!
Unlock the potential of candlestick pattern analysis with Candle Pattern Spotter. Say goodbye to missed opportunities and hello to a world of trading success. Embrace this remarkable tool and witness the transformation in your trading strategy. Start using Candle Pattern Spotter today and achieve the success you deserve.
Don't wait any longer. Take control of your trading journey and let Candle Pattern Spotter guide you towards profitable trades. The future of candlestick pattern analysis is here, and it's in your hands. Get ready to elevate your trading game and achieve the success you deserve.