A
cycle
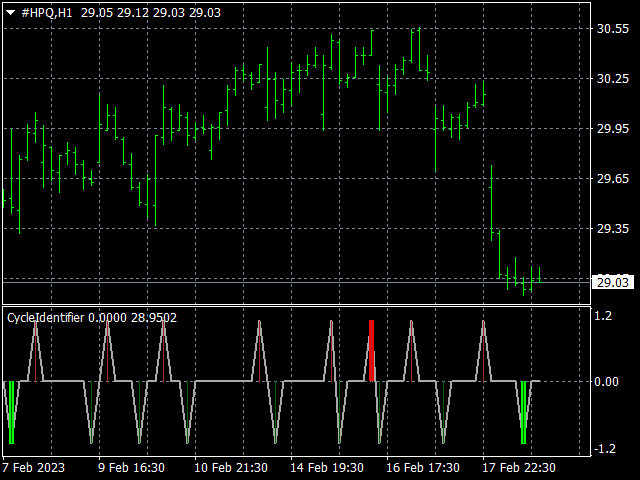
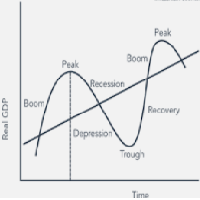
is a recognizable price pattern or movement that occurs with some degree of regularity in a specific time period. The analysis of cycles shows us
support and resistance
that represent smart places to anticipate a reaction in the price of an asset, and therefore represent a basic tool in technical analysis. Cycle lengths are measured from trough to trough, the most stable portion of a cycle. The information you find on this page is useful to combine with
Elliott wave analysis
. It's also a valuable tool to understand what is happening in the different asset classes:
bonds
,
equities
,
commodities
and the
U.S. dollar
.
 A cycle is a recognizable price pattern or movement that occurs with some degree of regularity in a specific time period. The analysis of cycles shows us support and resistance that represent smart places to anticipate a reaction in the price of an asset, and therefore represent a basic tool in technical analysis. Cycle lengths are measured from trough to trough, the most stable portion of a cycle. The information you find on this page is useful to combine with Elliott wave analysis . It's also a valuable tool to understand what is happening in the different asset classes: bonds , equities , commodities and the U.S. dollar .