Limited time promotion!
Cappuccino
Cappuccino's function is to help you in the analysis of an asset, providing accurate information that will help you in making a decision to enter or exit a trade.
Download the Cappuccino Limited demo version https://www.mql5.com/en/market/product/101816?source=Site+Search . You will be able to test all the functionalities, without restrictions, for one month. Try Cappuccino free for a month and see how it can help you with your investments.
As you know, the price of an asset on the financial market is formed by the struggle between buyers and sellers. These players can be other investors like you or large institutions, market makers or investment robots.
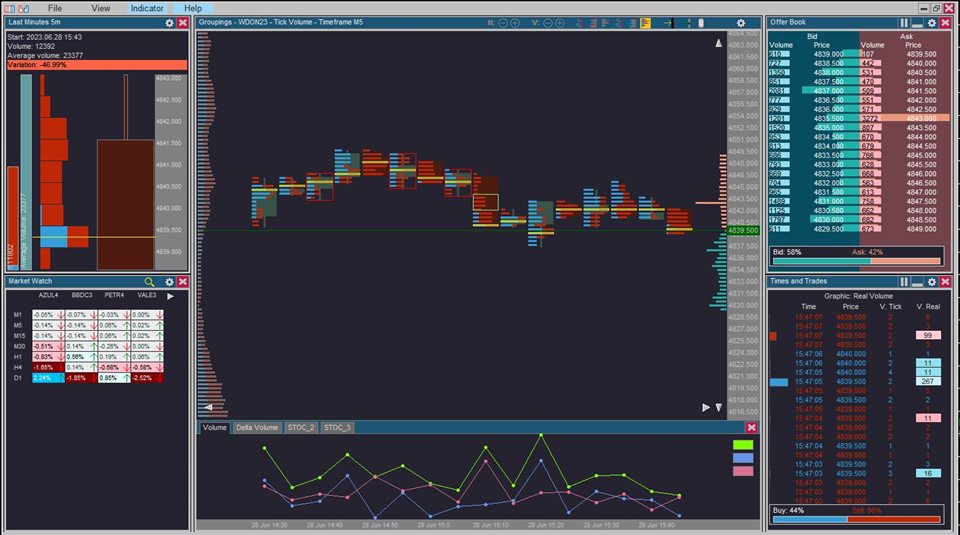
To help you succeed in your negotiations, O Cappuccino has five tools:
· Times and Trades .
· Offer Book .
· Market Watch .
· Last Minutes .
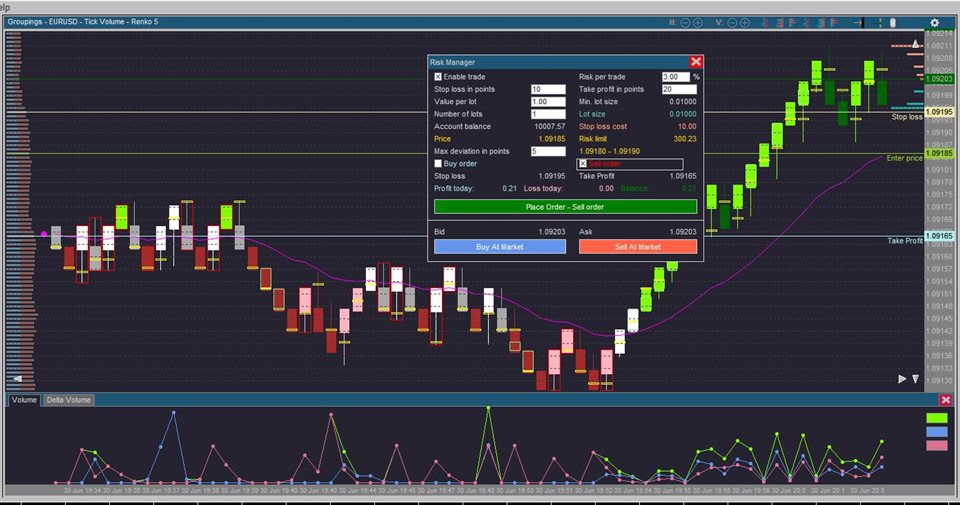
· Grouping Module . The latter has a Risk Manager and the ability to send orders to the stock exchange. And the functionality to implement Coloring Rules to visualize trends.
The tools are complementary and each one shows a facet of the market.
· Times and Trades presents a list containing the latest trades that occurred on the stock exchange. In addition to the colors being fully configurable, it allows you to define a presentation filter and color alert according to the volume values.
· The purpose of the Offer Book display is to show the investor's intention, whether buying or selling. Information is shown in list and graph form, with visible separation between buyers and sellers.
· The Market Watch allows you to see, at a glance, how asset prices are behaving. You can see the behavior of the price at different times. In addition, you can simultaneously analyze other assets that make sense for your trade. Here you can also configure alerts to highlight significant price variations.
· The Last Minute display is not linked to any type of aggregation. As the name implies, it shows the behavior of the asset's price and volume over the last few minutes. Its main function is to show how much outside the average the volume of the asset is at the current moment.
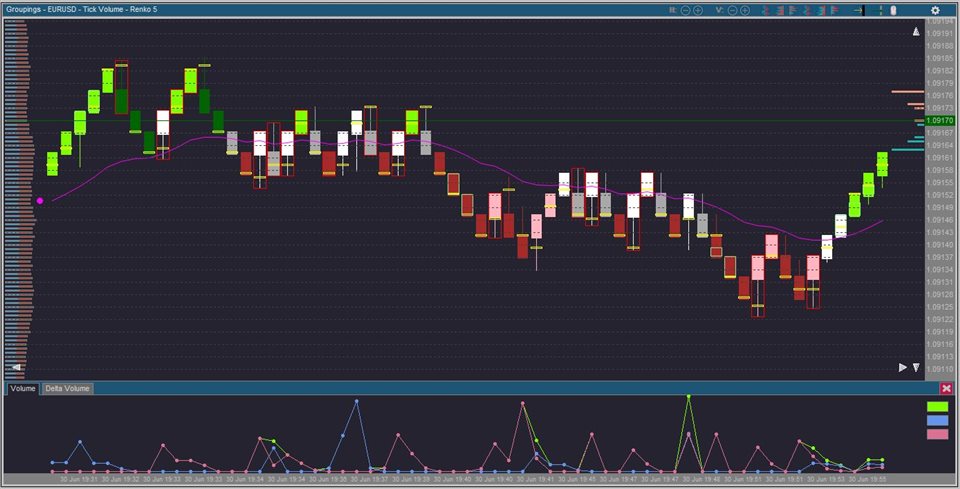
· Finally, the information Grouping Module allows you to see, in graphical form, price and volume movements from various angles. That is, grouping by time. Grouping by real volume. Grouping by tick volume. And grouping by price change or Renko chart.
Grouping Module is the heart of Cappuccino. It has many built-in tools. Like:
- Moving average,
- Stochastic,
- MACD,
- Parabolic SAR,
- Bollinger Bands.
- Risk Manager
- Charts of volume by candle, broken down by buy and sell attacks, volume delta and delta accumulation.
- Coloring Rules.
- Point Of Control
- Imbalance
- Delta Divergence
On our YouTube channel (@ unicriar7633) there are several tutorials so you can get to know Cappuccino better.