 With TrendWatch Indicator you will be able to identify trends on any symbol and any timeframe. Choose the easy way, use TrendWatch indicator, and find your settings on your favourite chart. The embedded pips counter helps you to find the best settings, that differ almost on every pair and timeframe. I will provide you some settings, so you can begin profitable trading. With many setting, you can personalize your chart.You can see, results immediately, or you can run indicator in strategy tester to see working live mode.
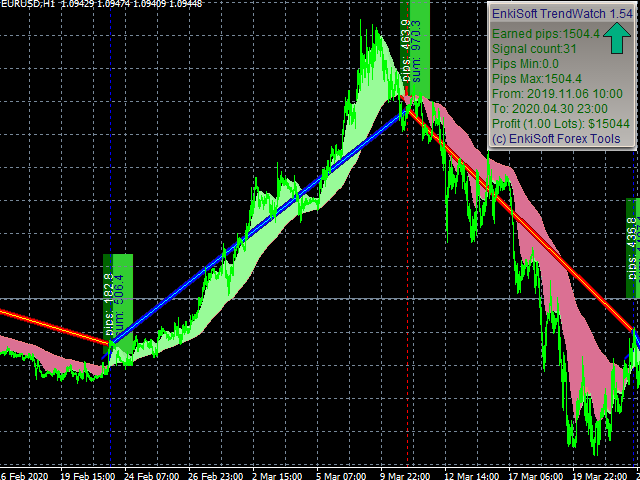
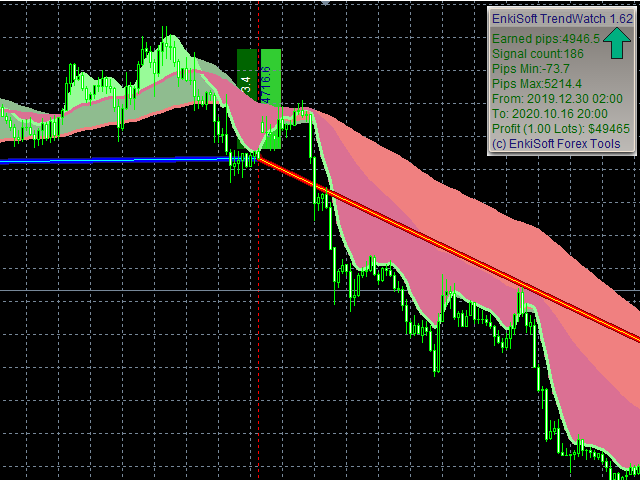
Main panel:
⦁ Earned pips (1 pip = 10 points)⦁ Signal count⦁ Minimum – maximum pips⦁ Controlled intervall⦁ Profit, with adjusted lot
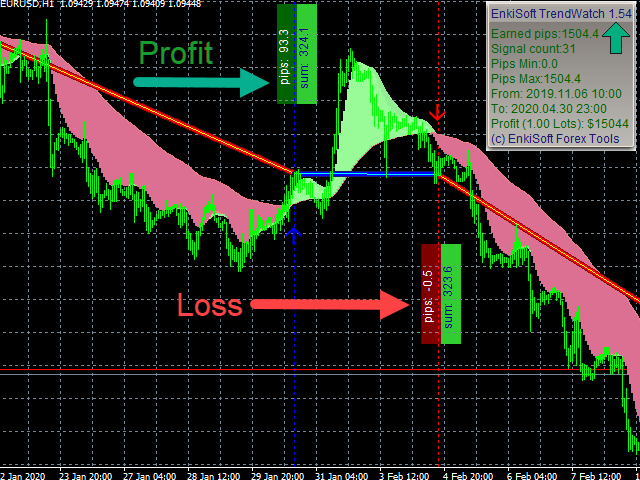
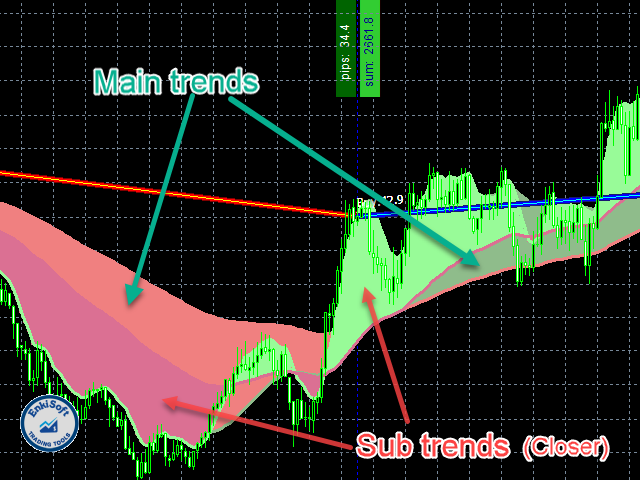
Chart objects:⦁ Identified trend direction⦁ Subtrend direction, with another color⦁ Recommended trade start and close points⦁ Laser style trade lines⦁ Live trade line in actual direction⦁ Buy and Sell signals on trend begin⦁ Buy and Sell signals during trend⦁ Close signals⦁ Stop loss values⦁ Trade results in $ and pips
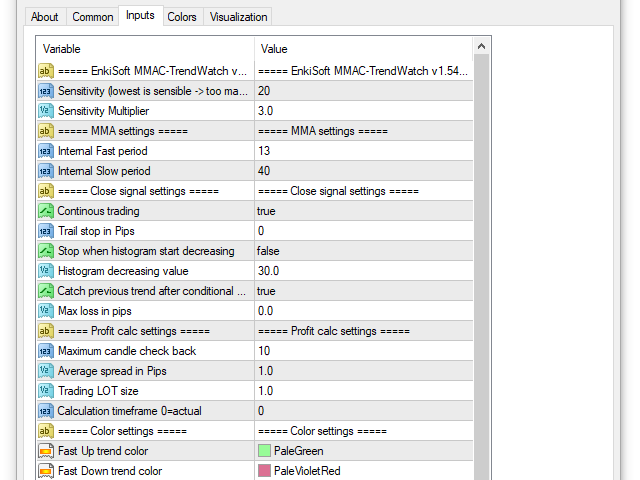
You can set that workingparameters:
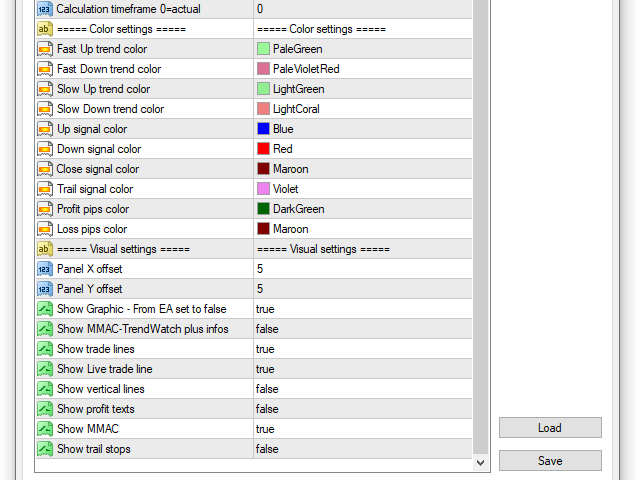
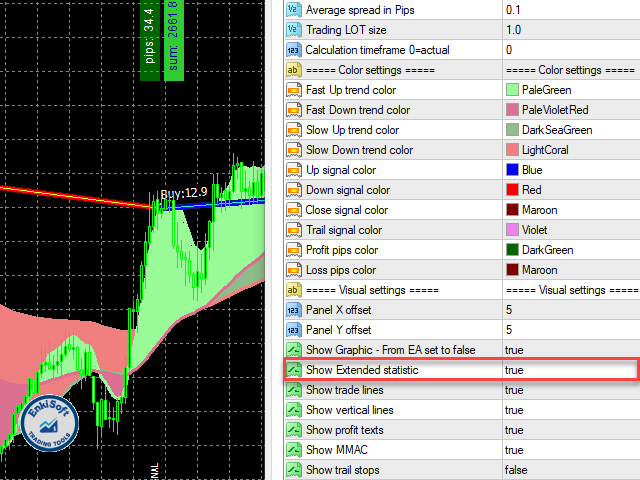
⦁ Sensitivity: trend sensitivity, in EMA value⦁ Sensitivity multiplier: Cross EMA multiplier⦁ Subtrend fast period: Fast EMA value⦁ Subtrend slow period: Slow EMA value⦁ Continous trading:if trade closed by conditional or signal value, start a new trade when catch an internal subtrend signal⦁ Trail stop in pips: Close trade, if price reverse (Sliding stop)⦁ Stop when histogram start decreasing: if the histogram (body of trend indicator) grow, the trend stronger, if histogram decrease, trend is weaker⦁ Histogram decreasing value: decreasing value in points⦁ Max loss in pips: if price against the trend, but no signal change, maximum allowed pips ins the wrong direction, before to close⦁ Maximum candle check back: on live chart bigger is better, on strategy tester need to set to 1 for the live testing⦁ Average spread in pips: Spread on actual symbol. Need for the profit calculation. Every trade profit decreased with this pips value (1 pips = 10 points)⦁ Trading lot size: Need for profit calculation (your profit, if every order send this lot value)⦁ Timeframe: indicator calculation timeframe in minutes. 0 = actual timeframe⦁ Color settings: Obvious colors for tend, and objects⦁ Panel X offset: Offset from chart right border⦁ Panel Y offset: Offset from chart top⦁ Show graphic – From EA set to false: Show graphical objects on chars. If you use indicator from an EA, you must set to false⦁ Show trade lines: Show or hide recommenden trade lines⦁ Show vertical lines: In vertical lines you van see indicator evets (Buy/sell signals, close signals, subtrend signals)⦁ Show profit texts: show profit and summa profit labels on the end of every trades⦁ Show MMAC: main and subtrend body⦁ Show trail stops
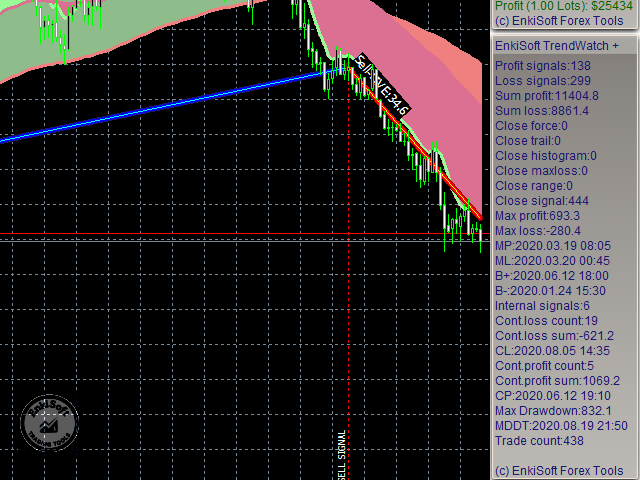
Version 1.60:
⦁ Show extended statistic info panel
New statistical informations:
⦁ Profit and loss signals count⦁ Sum profits and losses⦁ Close types (trail, histogram, maxloss, range, signal)⦁ Max profit and loss with date⦁ Max and min balance date⦁ Continous losses (count, value, date)⦁ Continous profits (count, value, date)⦁ Max drawdown and date⦁ Trade (signal) count
Usage from EA:
From EA, you can use this arrays:0. Main trend histogram Fast1. Main trend histogram Slow2. Main trend MMA Fast3. Main trend MMA Slow4. UP signal5. DOWN signal6. CLOSE signal7. Signal for EA: Sell=-1, Buy:18. TRAIL signal9. BUY internal10. SELL internal14. Subtrend MMA Fast15. Subtrend MMA Slow
Personalize your settings, and you will find your gold mine!