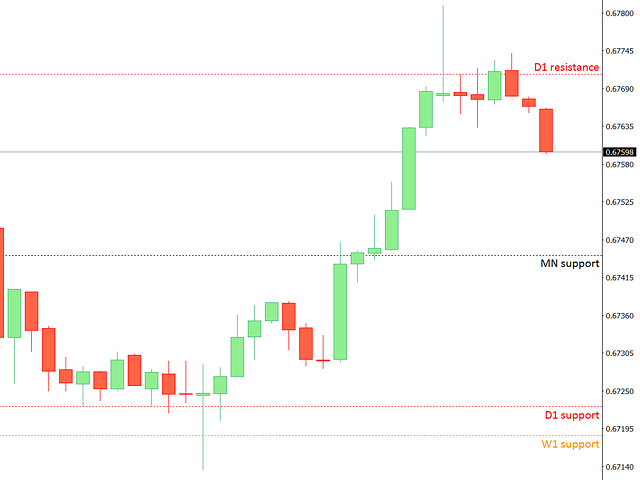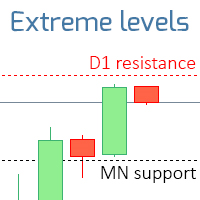
The indicator displays the levels that are extremes for the specified time frames.
- Resistance level is the maximum price of the last closed bar;
- Support level is the minimum price of the last closed bar;
2 operating modes:
- Real bodies: Open and Close prices will be used;
- Extremes: High and Low prices will be used;
This indicator:
- Helps to see potential reversal levels;
- Patterns formed near the levels have more potential;
- When working on a lower time frames - help you to see the overall picture;
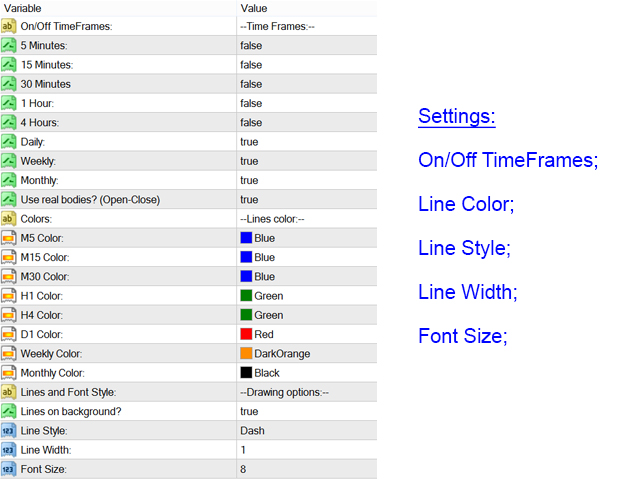
Input Settings:
- TimeFrames : M5, M15, M30, H1, H4, D1, W1, MN; The indicator will display the levels of those timeframes that are marked TRUE ;
- Use Real Bodies : 1) if true : real bodies will be used ( Open , Close ); 2) if fal se : extreme values will be used ( High , Low );
- Line Colors : the color of lines and labels for each time frame;
- Lines on Background : if ( true ): draw lines in the background;
- Line Style : (solid/dotted/dash...);
- Line Width;
- Font Size : for labels;