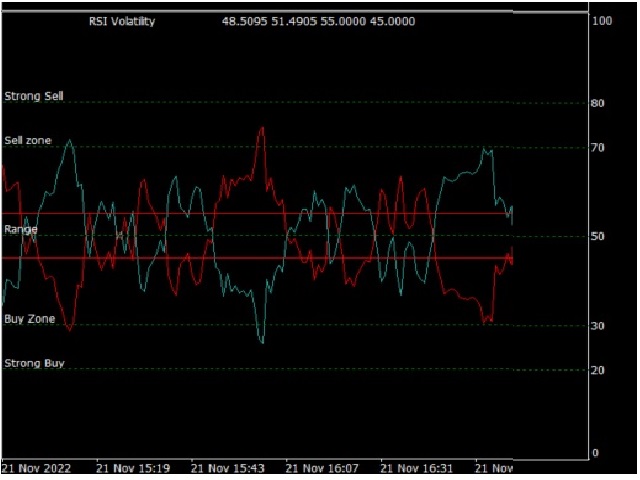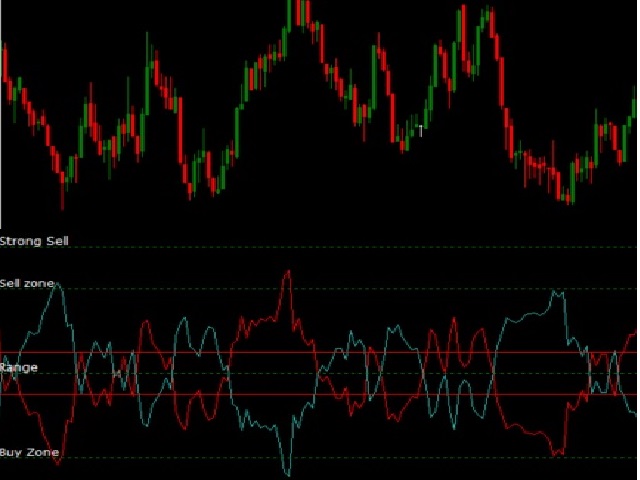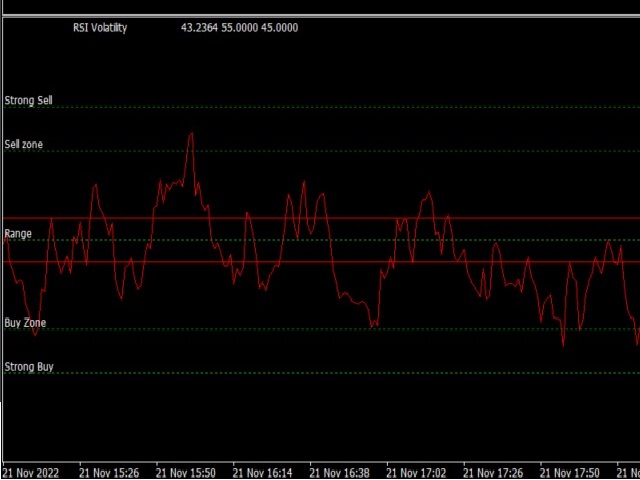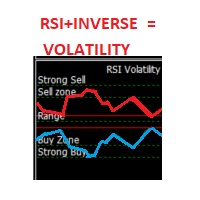
This indicator is an oscillator that shows the RSI (Relative Strength Index)
in red and its inverse graph in a light green. Together this shows
the volatility of the market (in its default setting). You can also change
it to show only the RSI graph. It also gives you the possibility
to change its Period. The oscillators zones (80,70,50,30,20) are marked by
Strong Sell, Sell Zone, Range, Buy Zone, and Strong Buy respectively.