This indicator is based on the Weis wave principle of wave volume. Below are few features of the indicator
- It draws the wave on the chart while the accumulated volume per wave in a different window at the bottom of the chart
- You can configure the turning point move
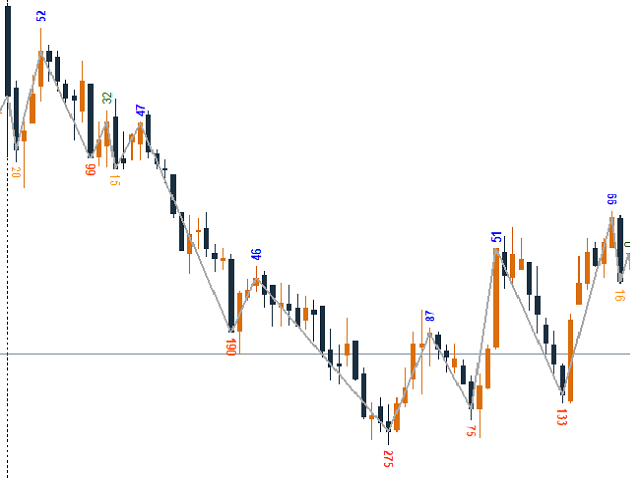
- It displays the accumulated volume (in thousands, eg for 15000 volume it will show 15) at the end of each wave
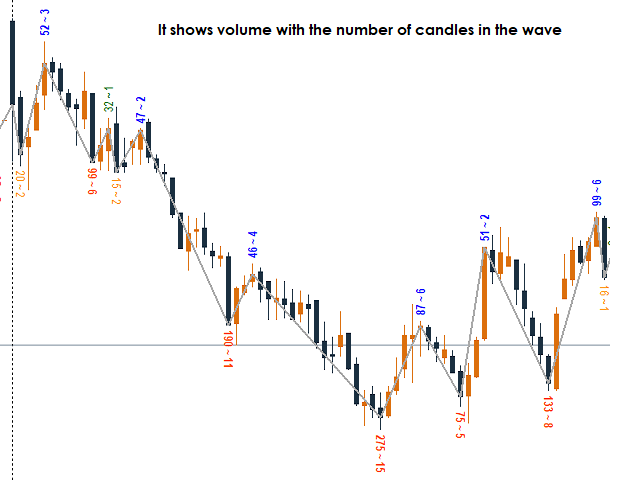
- You can also configure to show number of candles in the wave along with the wave volume
- The indicator calculates the distinct volume by historical analysis and colors them differently for you to pick easily
Parameters
- Difference - It is for wave variance. Keep it 0
- LabelShift - Distance from candle where the wave volume is shown. Keep it 20
- waveHistory - Number of Up or Down wave the indicator will analyze to come up with significant volume
- customizePip - It adjusts the pip size for better wave configuration. One setup will automatically fit for all stocks of different values, be it 5 $ or 1000$ stock. Keep it TRUE
- showVolume - It will show volume in thousands at the end of each wave on the chart. Keep it TRUE
- showBarCount - Shows the bar count along with volume. Keep it TRUE if you want that data
- truncateVolume - It will show volume in thousands. For exact volume to display you can set it to FALSE
- showAlert - Alert is for the next version release. Keep it FALSE for the moment
- upNormal - Color to display routine volume with no impact in the change in behavior in UP wave
- upHigh - Color to display any high volume in the wave that could sign the possible change of behavior in UP wave
- upLow - Color to show very low volume in the wave that could suggest shallow supply or demand in UP wave
- dnNormal - Color to display routine volume with no impact in the change of behavior in DOWN wave
- dnHigh - Color to show very high volume in the wave that could sign the possible change of behavior in DOWN wave
- dnLow - Color to show very low volume in the wave that could suggest shallow supply or demand in DOWN wave
- waveWidth - Width of the wave line on chart. Keep it 2 for better look
- waveColor - Color of the wave line in chart. Chose that best suits your template