https://www.youtube.com/watch?v=ygibWOftQ7c <---- CHECK OUT HOW IT TRADES VISUALLY HERE
Currency - Eur/Usd
Candle Time - 1m for best results(works on multiple timeframes)
Recomended Broker - IG(works on most)
Leverage - 1:200
Fully Automated EA for Longs and Shorts You can adjust to whichever RSI period and value you want.
-RSI PERIODS & VALUES WHEN THEY CROSS ARE ALL ADJUSTABLE IN THE INPUTS AS WELL AS COLOR OF WORDS AND NUMBERS
Default settings are to...
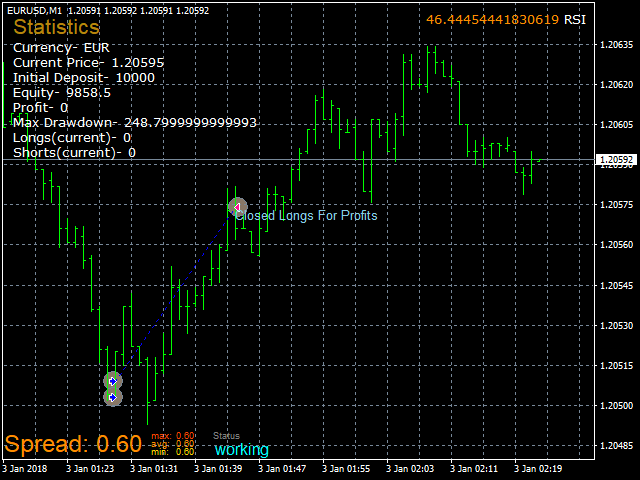
LONGS - are to buy when RSI crosses below 15. If RSI for longs crosses above 70 it will mark CLOSED FOR PROFITS .
SHORTS - are to sell when RSI crosses above 75. If RSI for shorts crosses below 20 it will mark CLOSED FOR PROFITS .
-USE AS A EXPERT ADVISOR
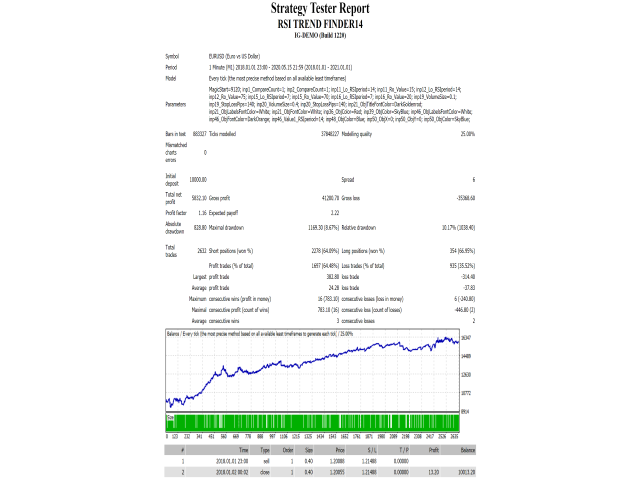
-BACKTESTING MATCHES LIVE DEMO
2018 - MAY 16, 2020
Bars in test    883327
Ticks modelled  37848227
Modelling quality       25.00%
Mismatched charts errors        0
Initial deposit 10000.00
Spread  6
Total net profit        5832.10
Gross profit    41200.70
Gross loss      -35368.60
Profit factor   1.16
Expected payoff 2.22
Absolute drawdown       828.80
Maximal drawdown        1169.30 (8.67%)
Relative drawdown       10.17% (1038.40)
Total trades    2632
Short positions (won %) 2278 (64.09%)
Long positions (won %)  354 (66.95%)
Profit trades (% of total)      1697 (64.48%)
Loss trades (% of total)        935 (35.52%)
        Largest
profit trade    382.80
loss trade      -314.40
        Average
profit trade    24.28
loss trade      -37.83
        Maximum
consecutive wins (profit in money)      16 (783.10)
consecutive losses (loss in money)      6 (-240.80)
        Maximal
consecutive profit (count of wins)      783.10 (16)
consecutive loss (count of losses)      -446.80 (2)
        Average
consecutive wins        3
consecutive losses      2