 DUCHOAN99 would like to send you the indicator Donchian Channels Multi Timeframe Real Value for MT5 .
Please download the demo to see if the indicator helps you or not before deciding to buy this indicator.
1. KEY TAKEAWAYS
Donchian Channels are a technical indicator seeks to identify bullish and bearish extremes that favor reversals as well as higher and lower breakouts, breakdowns, and emerging trends.
The middle band simply computes the average between the highest high over N periods and the lowest low over N periods.
These points identify the median or mean reversion price.2. What Do Donchian Channels Tell You?
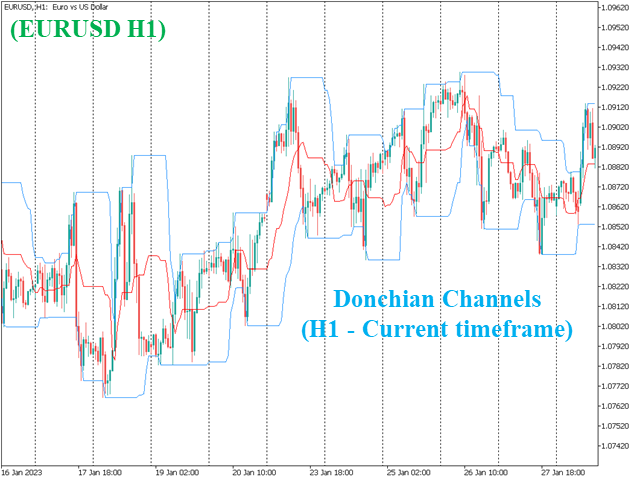
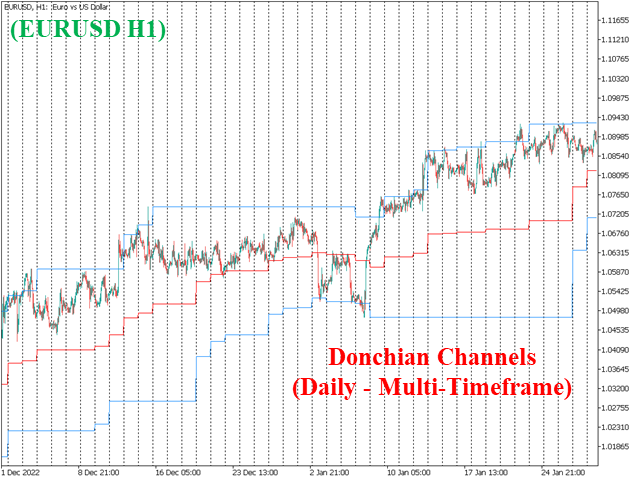
Donchian Channels identify comparative relationships between the current price and trading ranges over predetermined periods. Three values build a visual map of price over time, similarly to Bollinger Bands, indicating the extent of bullishness and bearishness for the chosen period. The top line identifies the extent of bullish energy, highlighting the highest price achieved for the period through the bull-bear conflict.
The center line identifies the median or mean reversion price for the period, highlighting the middle ground achieved for the period through the bull-bear conflict. The bottom line identifies the extent of bearish energy, highlighting the lowest price achieved for the period through the bull-bear conflict.3. The Difference Between Donchian Channels and Bollinger BandsDonchian Channels plot the highest high and lowest low over N periods while Bollinger Bands plot a simple moving average (SMA) for N periods plus/minus the standard deviation of price for N periods X 2. This results in a more balanced calculation that reduces the impact of big high or low prints.---If you want the MT4 version, please contact me!Hope the indicator will make your trading system perfect!
Feel free to contact me with any questions or requests!Good luck and success!