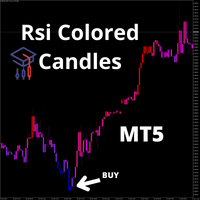
This indicator Aims to Replace The Traditional Rsi By Adding The Rsi Directly On the chart and using four color scheme to represent it
the idea behind the indicator is to :
- save space on chart by reducing the need for an indicator window
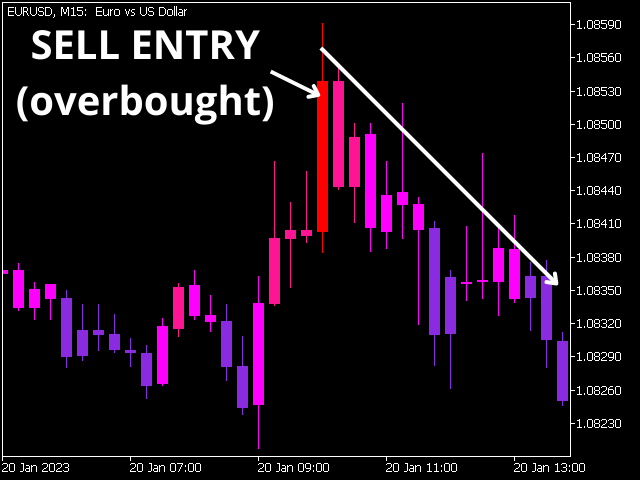
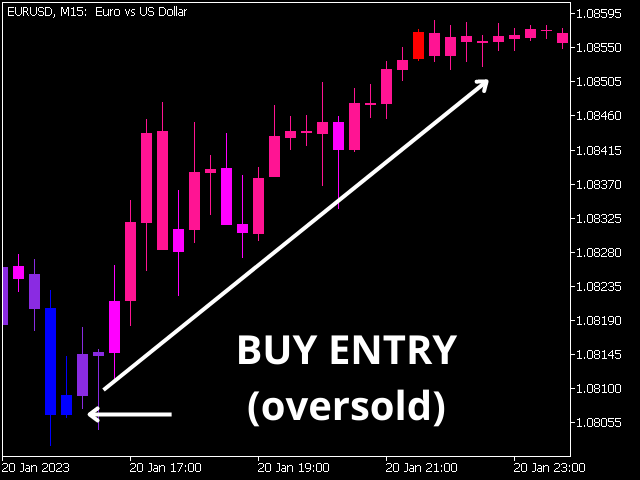
- show you the overbought (RED CANDLE) and oversold(BLUE CANDLE) zones on the candles giving you a better chance to get a better ENTRY
- Could be used with Supply and Demand areas to maximize Profitability
Trading Signals :
- blue candles to buy
- red candles to sell
Recommendations :
- use the Rsi period 6 to give you better signals
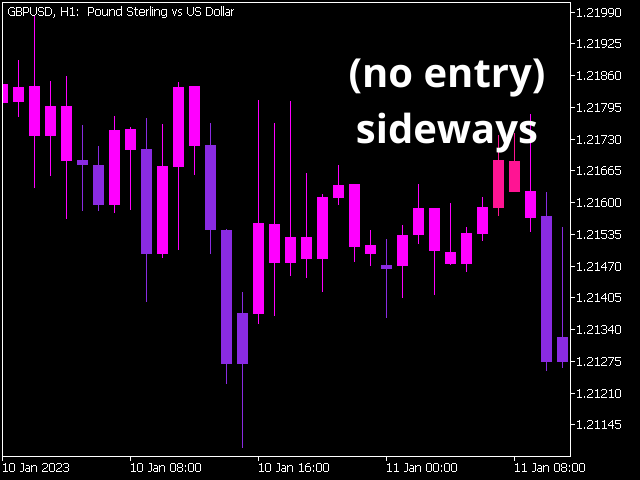
- respect the market direction to choose your entry . don't buy with blue candles when market is heading down don't sell with red candles when market is heading up
- Always use with other indicators or price action to get more confirmations on your entry