DUCHOAN99 would like to send you the
indicator
RSI Colour Multi Timeframe Real Value for MT5
(
Colour Relative Strength Index Multiple Timeframe Real Value for MT5
).
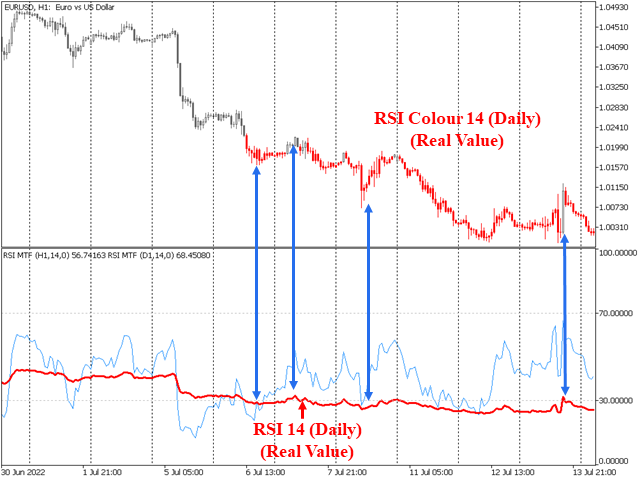
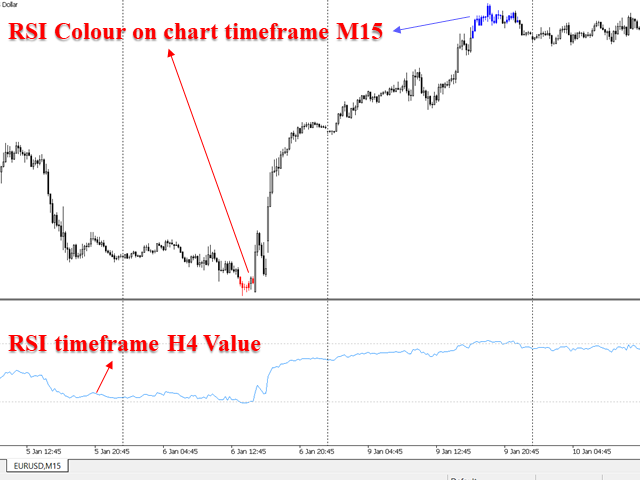
1. As the name suggests,
the indicator shows exactly its value at the selected Timeframe.
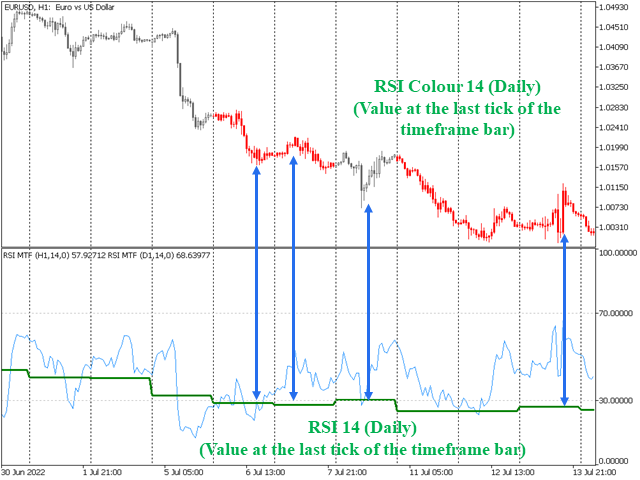
2. The indicator has 2 display types: (
See attached screenshots to better understand these 2 types)
-
Real Value: the indicator shows exactly its value at the selected Timeframe. (Highly recommended)
-
Value at the last tick of the timeframe bar. (Commonly used in other simple Multi-Timeframe indicators. Value may not be real value at the time of bar formation, to be able to properly analyze, this type should not be used.).
3. Input parameters:
-
Timeframe of data collection (Default: current)
-
Type of value you want to display (
REAL value
or
Value at the last tick of the timeframe bar
)
(Default: REAL value)
-
-
Period
(Default: 14)
-
Applied price
(Default: Close)
-
RSI overbought level
(Default: 70)
-
Color RSI overbought level
(Default: Green)
-
RSI oversold level
(Default: 30)
-
Color RSI oversold level
(Default: Red)
Hope the indicator will make your trading system perfect!
Feel free to contact me with any questions or requests!
Good luck and success!
 DUCHOAN99 would like to send you the indicator RSI Colour Multi Timeframe Real Value for MT5 ( Colour Relative Strength Index Multiple Timeframe Real Value for MT5 ).