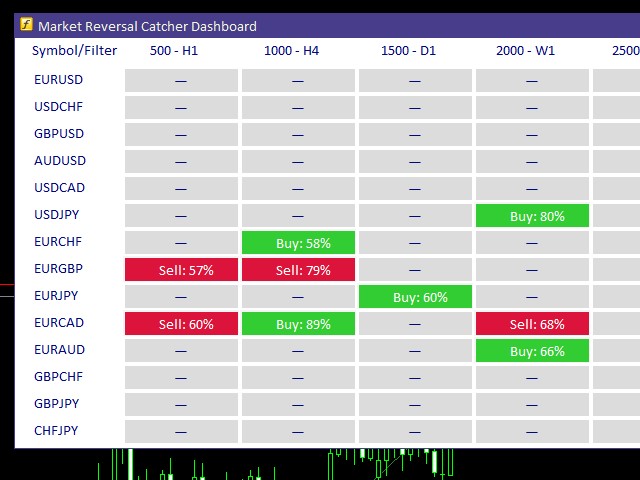
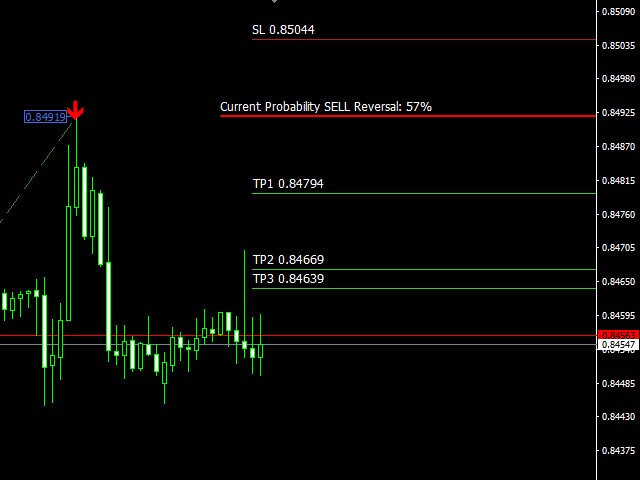
 Market Reversal Catcher Dashboard indicator looks for market reversal points or major pullback. To do this, it analyzes previous price movements and using a flexible algorithm for estimating the probability of a reversal, also gives recommendations on entry points and sets recommended profit targets for positions opened on a signal.
The dashboard is designed to sit on a chart on it's own and work in the background to send you alerts on your chosen pairs and timeframes.
Dashboard does not require any additional indicators to purchase!
Advantages:
- Works with any timeframes and financial instruments , including forex, cryptocurrencies, metals, stocks, indices
- Simple, visual and efficient trend detection
- Three-level profit fixation system
- Flexible analytical calculation and evaluation of market movements
- Simple rules of use
- Suitable for beginners and experienced traders
- Indicator never redraws, recalculates or completes signals
- Fully visually customizable
Parameters:
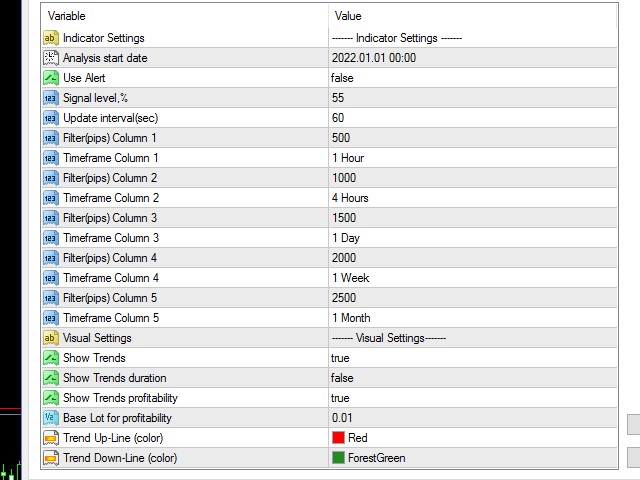
- Analysis start date — date and time from which the analysis of the movement in the market is carried out
- Use Alert — receive signal notifications
- Signal Level — signal level in percent at which notifications will be received
- Update Interval(sec) — Search interval for new signals in seconds
- Filter(pips) Column 1 — minimum movement value in points for column 1
- Timeframe Column 1 — timeframe of the selected currency pair for column 1
- Filter(pips) Column 2 — minimum movement value in points for column 2
- Timeframe Column 2 — timeframe of the selected currency pair for column 2
- Filter(pips) Column 3 — minimum movement value in points for column 3
- Timeframe Column 3 — timeframe of the selected currency pair for column 3
- Filter(pips) Column 4 — minimum movement value in points for column 4
- Timeframe Column 4 — timeframe of the selected currency pair for column 4
- Filter(pips) Column 5 — minimum movement value in points for column 5
- Timeframe Column 5 — timeframe of the selected currency pair for column 5
- Show Trends — display analyzed trends
- Show Trends duration — display the duration of the analyzed trends
- Show Trends profitability — display the profitability of the analyzed trends
- Base Lot for profitability — lot for calculating the profitability of the analyzed trends
- Trend Up-Line (color) — uptrend drawing color
- Trend Down-Line (color) — color for drawing downtrends