Market Zones
This indicator provides an easy way to get to trade based on Gaussian statistical levels similar to the Market Profile ® methodology.
Using an exclusive formula the indicator estimates dinamic zones where the market movements statistically remains most of the time (70%), this allows to see the market on a simplified way avoiding following non-relevant bar movements.
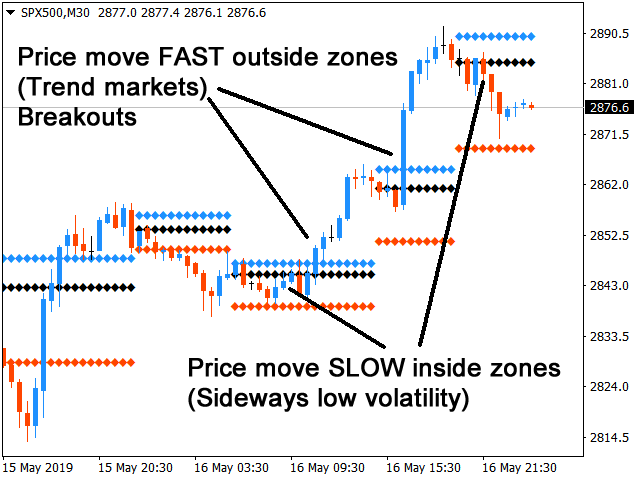
Prices stay calm inside market zones and tend to move faster outside the zones. This is crutial to identify best zones to trade breakouts, following-trend or sideways strategies.
Lines description
Each 3 lines together represents a RANGE where statistically price will remain moving inside the range.
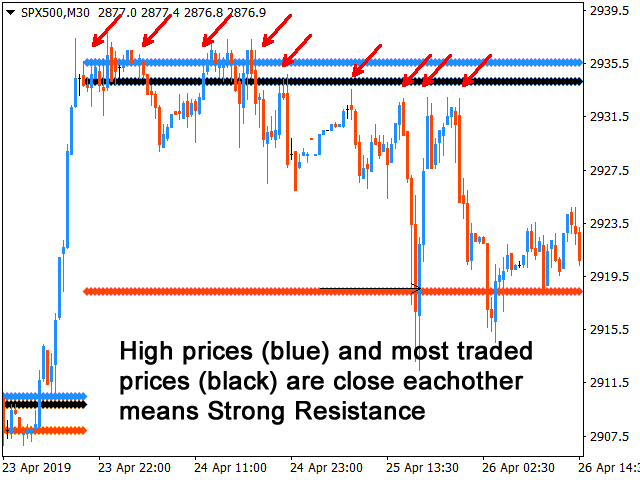
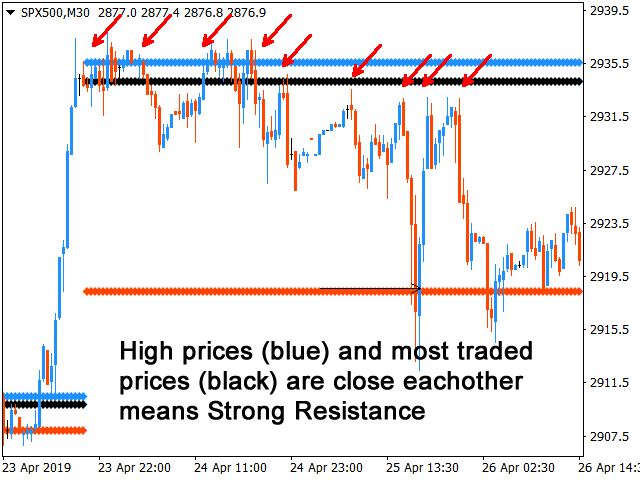
- Blue color line represents top of the range / highest price.
- Black color line represents "most traded price" inside the range.
- Red color line represtens bottom of the range / lowest prices.
Zones shapes
Note that every zone is unique, depending on the market movements that generates them.
- Narrow zones represents "low volatility" market conditions.
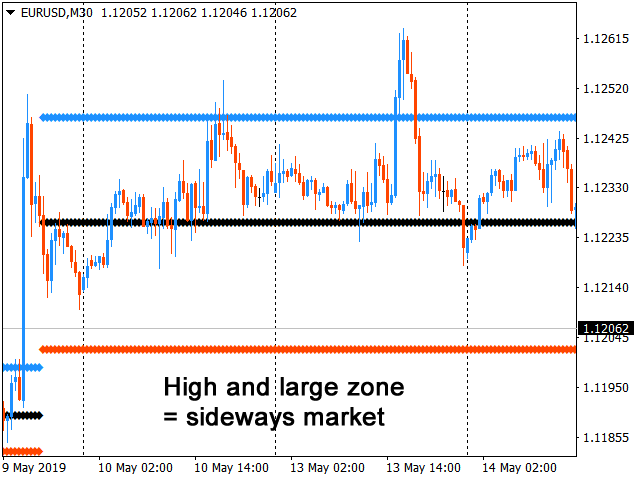
- Wide zones represents "high volatility" market conditions.
- Long zones are indicative of sideways markets.
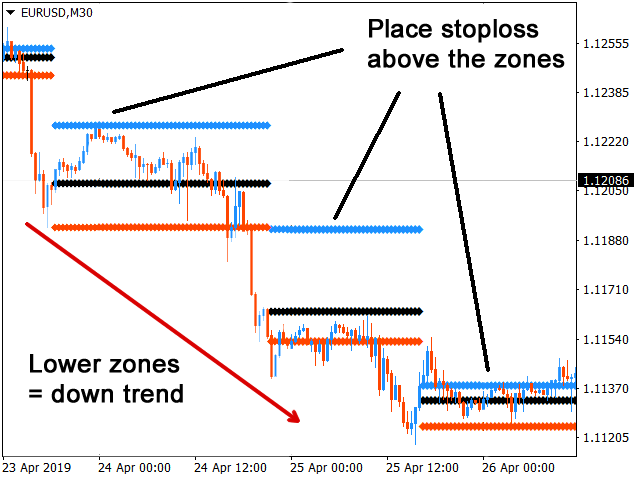
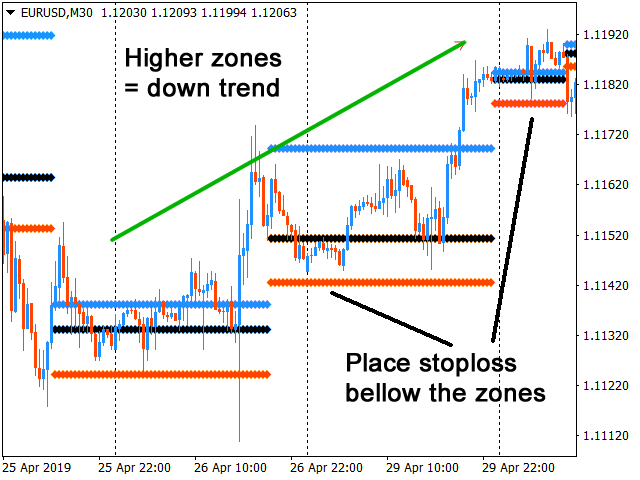
- Short zones are indicative of trending markets.
Parameters
1. Timeframe . The timeframe to use for the calculations. This allows to trade using multiple timeframes on the same chart.
2. Use Volume . Check true is you want broker volume to be used to calculate zones.
3. Back Bars . Number of bars on the current chart to show zones.
Examples of use
- When price cross above blue line there is high probability of a bullish breakout.
- When price bross bellow red line there is high probability of a bearish breakout.
- When trading short the stoploss are better situated above blue line.
- When trading long the stoploss are better situated bellow red line.