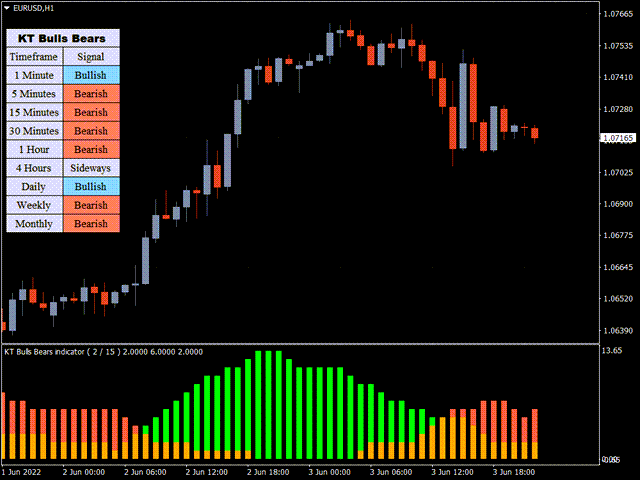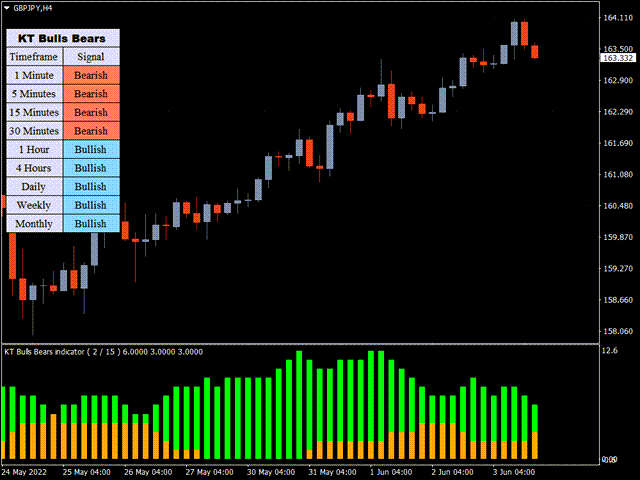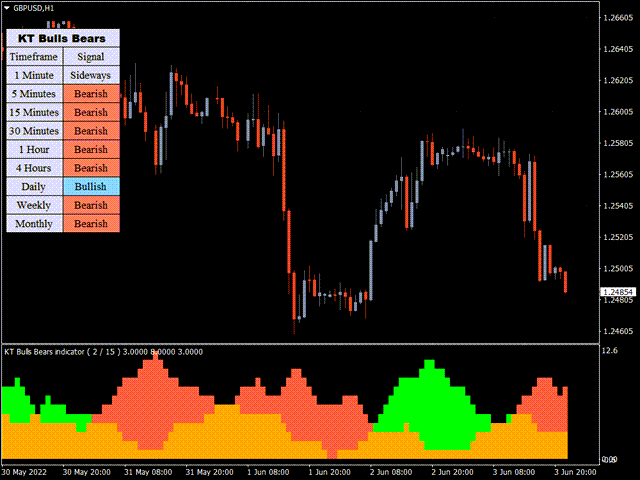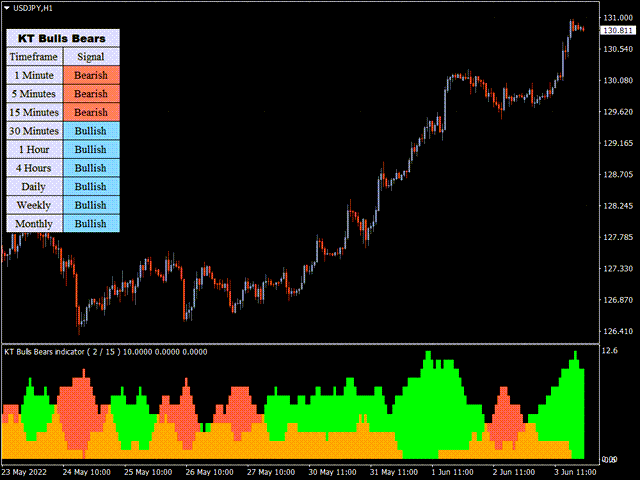
This indicator shows the bullish/bearish market regime using the no. of bars moved above and below the overbought/oversold region of RSI. The green histogram depicts the Bull power, while the red depicts the Bear power.
Features
- It can be used to enter new trades or validates trades from other strategies or indicators.
- It comes with a multi-timeframe scanner that scans the bulls/bears power across all the time frames.
- It's a perfect choice to boost the confidence of new traders via validating their entries using the bulls/bears power.
- All Metatrader alerts included.
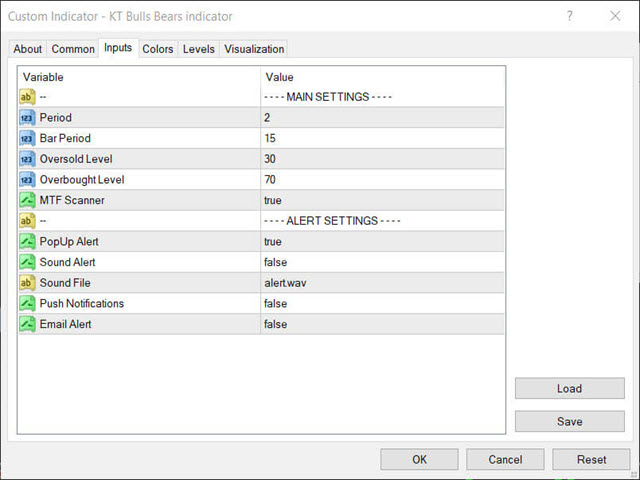
Input Parameters
- Period: the RSI period used to identify the OBOS levels.
- Bar Period: No. of bars to include above/below the RSI OBOS levels.
- Oversold Level: A level in RSI to decide the OS level.
- Overbought Level: A level in RSI to decide the OB level.
- MTF Scanner: Multi-Timeframe scanner to fetch the signals from all available time-frames.
- Alert Settings