The volume is a graphical indicator that shows the number of shares traded in a specified period (for example, minutes / hours / days / weeks / months, etc.) for a particular asset. Volume analysis is a basic, yet very important, element of technical analysis. It provides clues as to the intensity of price movements. In addition, the volume can confirm the strength of a trend.
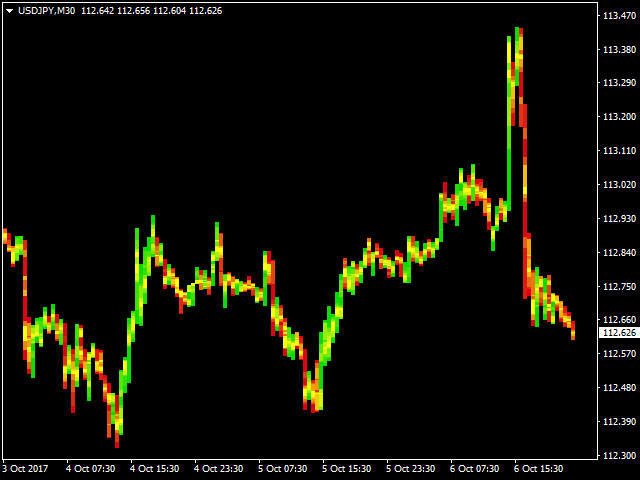
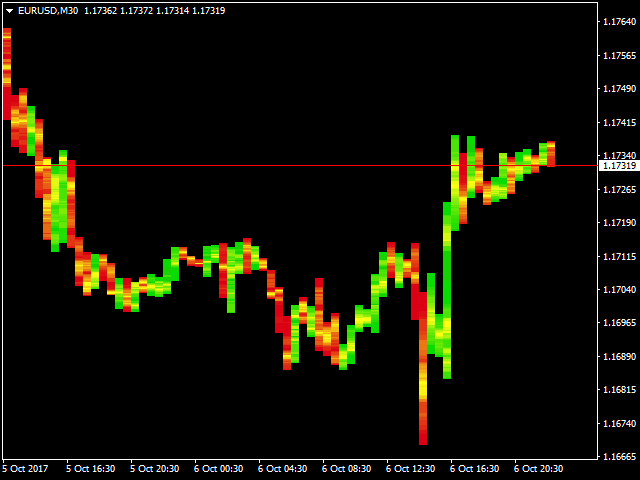
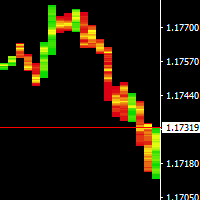
Standard candles do not provide a visual way of looking at buying power and selling power.
With that in mind, I created the indicator with temperature candles that provides a more effective view of what is happening in the market.
Indicator Parameters
- MaxMinVolume_AllCandles - false / true - determination of maximum / min volume on each candle separately / on all candles
- CandleShadow - Display "temperature" in the shadows of the candles
- CandleBody- Display "temperature" on the bodies of candles
- BullSpectrum- Spectrum for candles "high"
- BearSpectrum- Spectrum for "low" candles
- VolumeTf- Time period (in minutes) from which the volume values are read
- DrawSize- Candle cell size (in points)
- SumBars- Number of candles to display the "temperature"