General
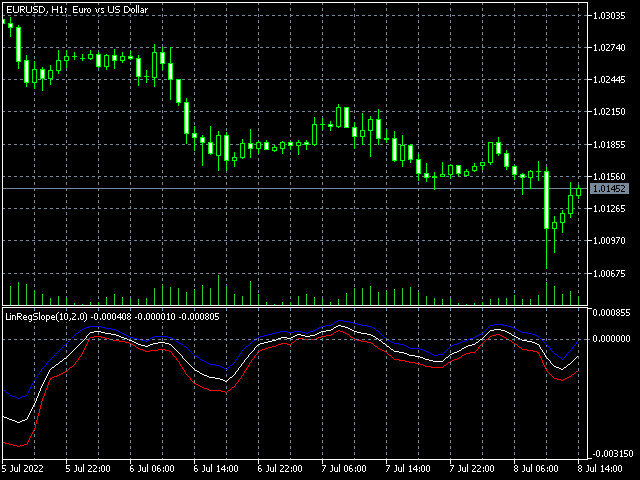
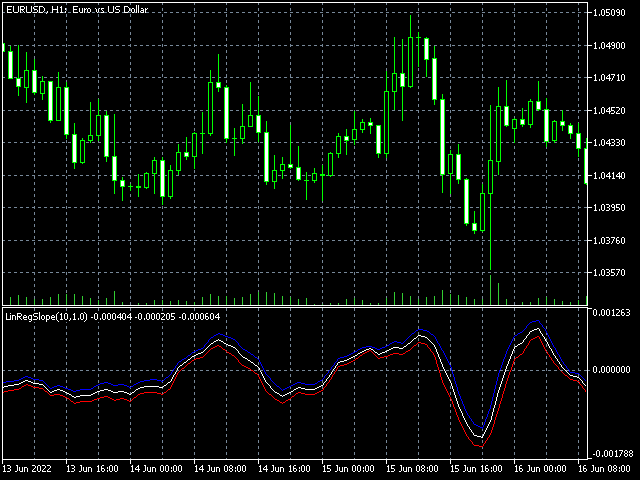
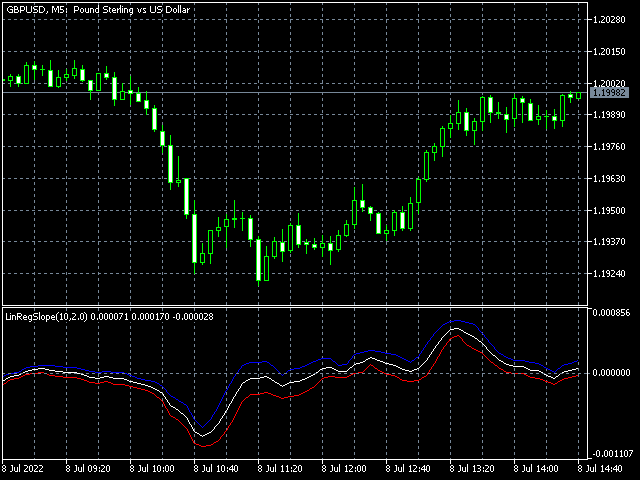
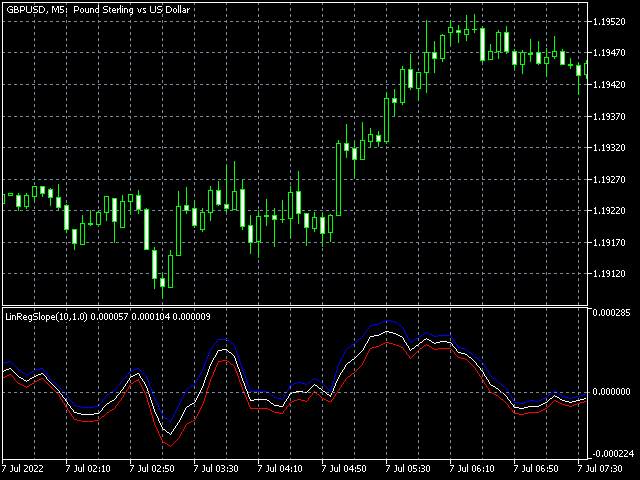
This indicator is based on the linear regression analysis model. This model assumes that the market has a fair price and that this price has a fair and continuous increase within the given period. The indicator shows the calculated fair slope and the bands of standard deviation surrounding it, so that by the latter it is possible to determine the significance of the trend.
Parameters
- Period: The number of values (e.g. bars) that should be used to calculate the fair slope.
- Width: Multiplier for the width of the bands of the standard deviation.
- RWeighted: Specifies whether the fair slope should be weighted with the R² value. The R² value indicates the extent to which the price development can be explained by the regression model.
Idea
Of course, everyone can make up his own mind what to do with an indicator. But here I would like to pass on a simple trading idea, namely the trend idea: if the lower band is above zero and no trend reversal from an upward to a downward trend can be seen, then this can be seen as a buy signal.