General
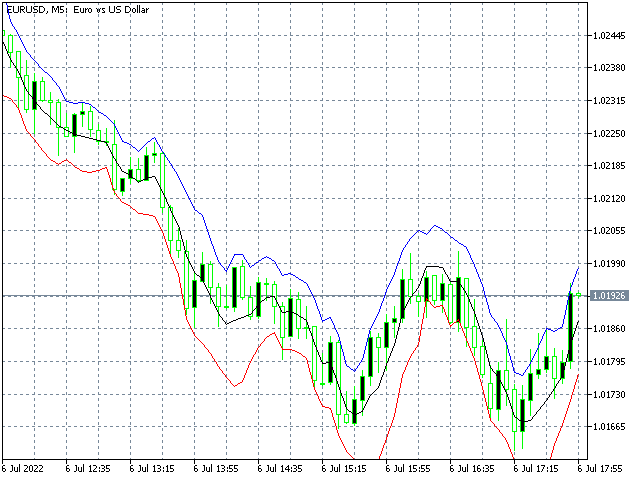
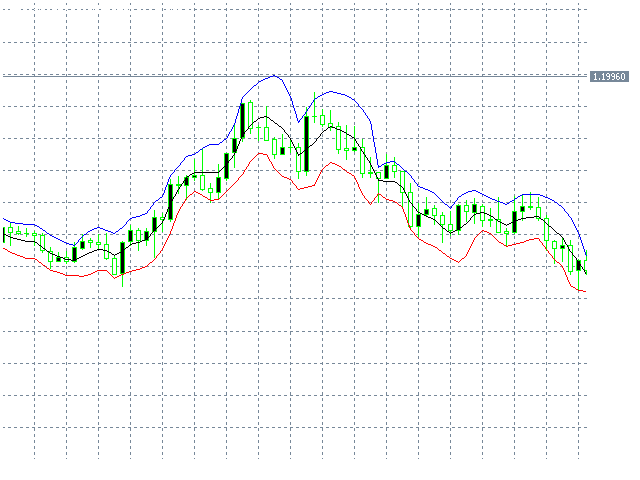
This indicator is based on the linear regression analysis model. This model assumes that the market has a fair price and that this price has a fair and continuous increase within the given period. The indicator shows the calculated fair price and the bands of standard deviation surrounding it, so that by the latter it is possible to determine the significance of a divergence of the price from the calculated fair price.
Parameters
- Period: The number of values (e.g. bars) that should be used to calculate the fair price.
- Width: Multiplier for the width of the bands of the standard deviation.
- RWeighted: Specifies whether the fair price should be weighted with the R² value. The R² value indicates the extent to which the price development can be explained by the regression model.
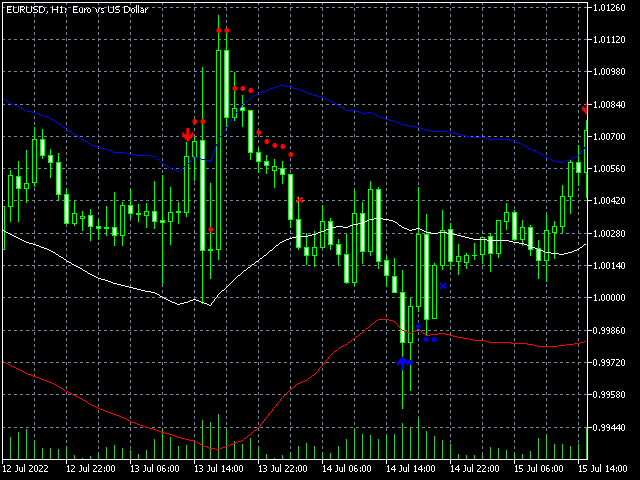
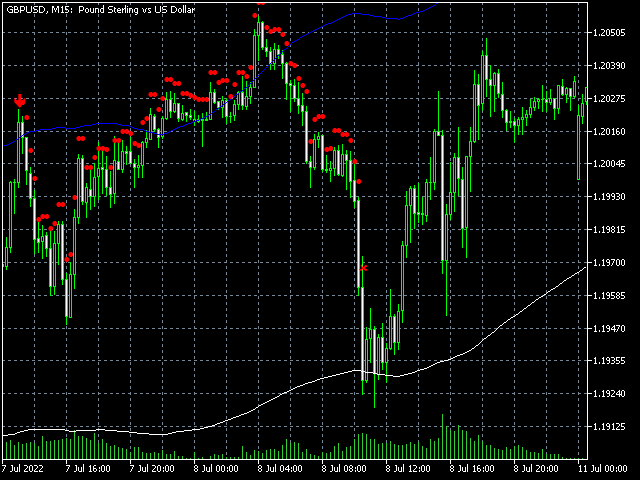
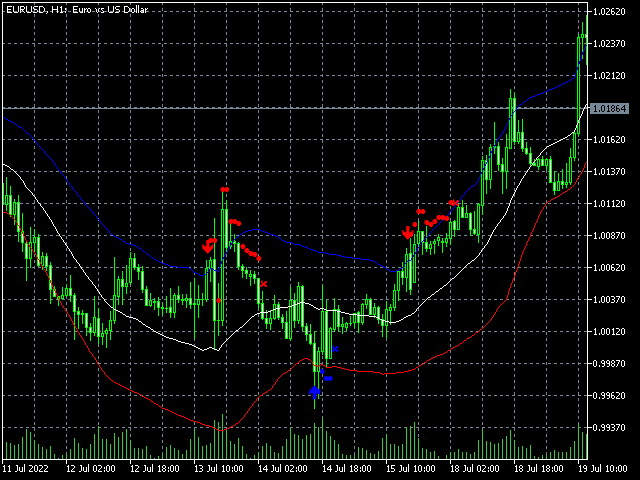
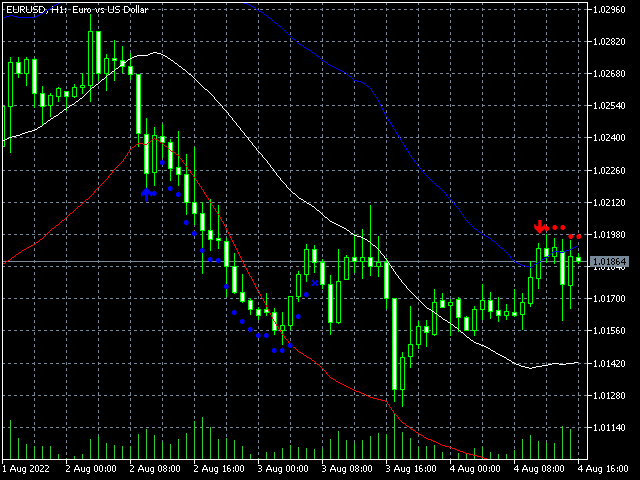
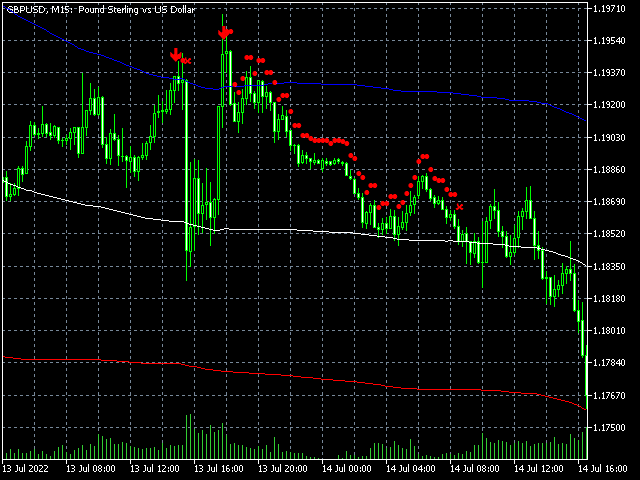
- ShowSignals: Specifies whether signals (Entry, Hold, Exit) are shown.
Ideas
Of course, everybody can come up with his own ideas of what to do with an indicator. But here I would like to pass on a simple trading idea.
1) The Reversal idea: If you set the Width parameter high enough, e.g. to 2, and the price rises above the upper band, this is either a signal for a very strong uptrend or for an overreaction. If the price falls below the upper band again, this can be seen as a sell signal.
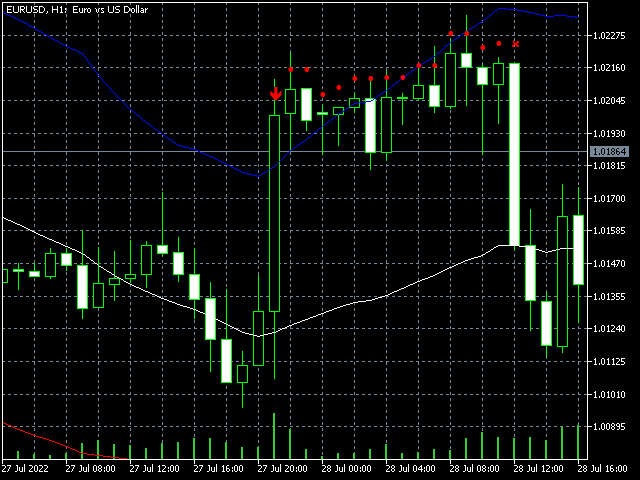
2) The trend idea: if you set the Width parameter low enough, e.g. to 1, the market is in an obvious downward movement and the price is within the upper and lower bands, this indicates that the downward movement is stable at the moment and there is no overreaction provoking a correction. So, such a constellation can be seen as a sell signal.