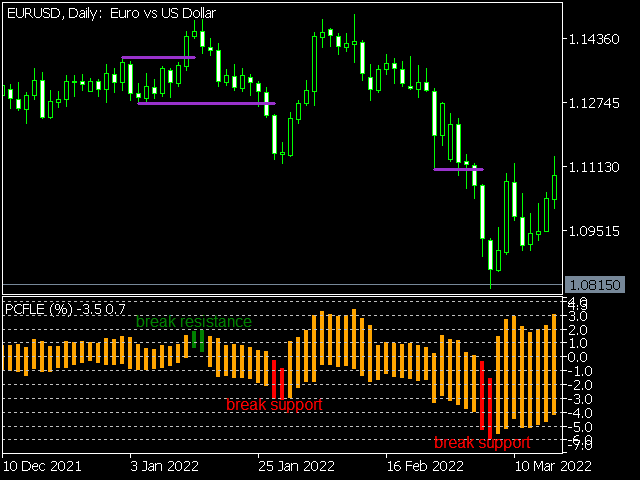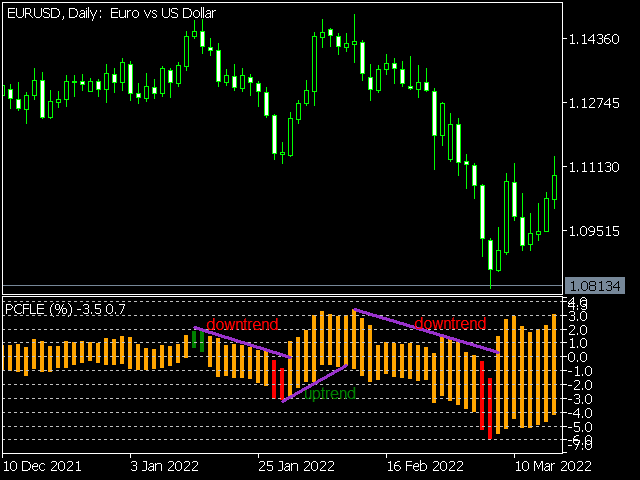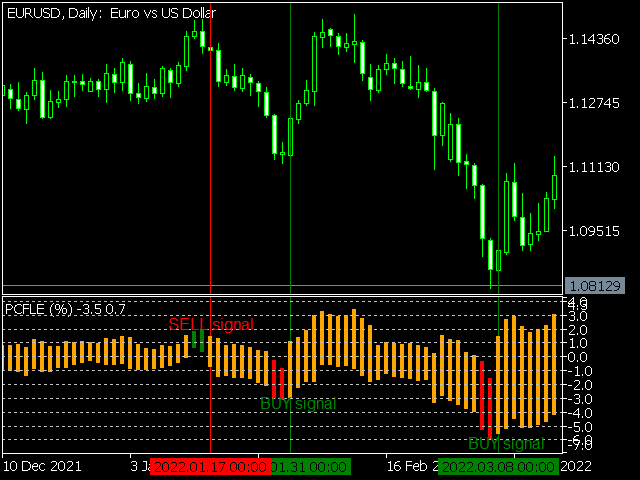
PCFLE Histogram (Price Change From the Last Extreme) - plots the percentage movement from the last extreme.
Can be used for graphical representation of percentage movement from last lowest low to current high / from last highest high to current low.
Input parametters:
- InpDigits - the number of decimal places displayed on the y-axis
You can set colors and horizontal levels in the indicator properties.
Examples of how to trade with the indicator can be found in screenshots.