Automatic marking of the chart with Pentagram models.
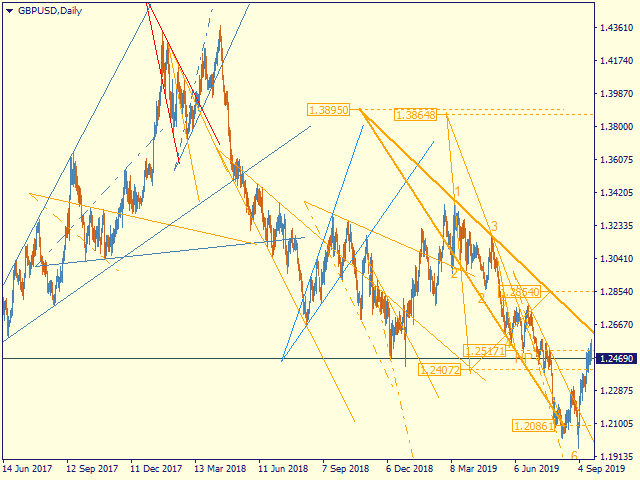
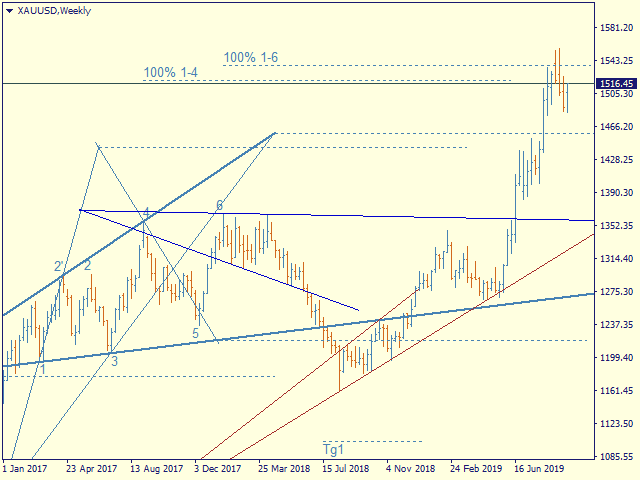
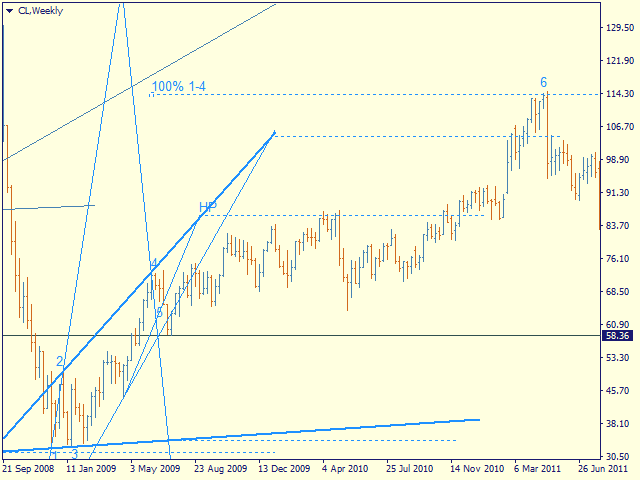
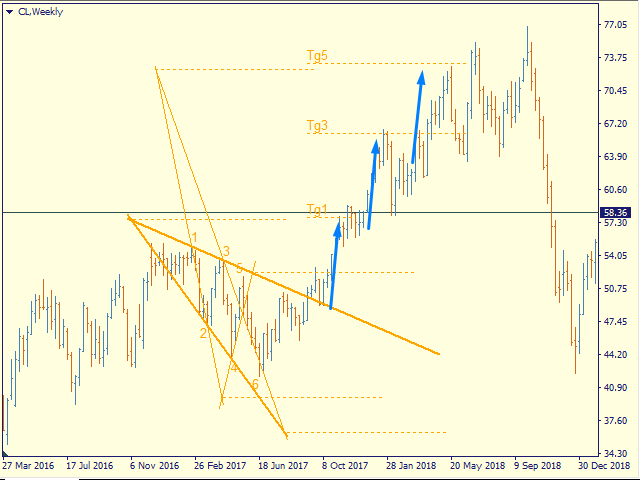
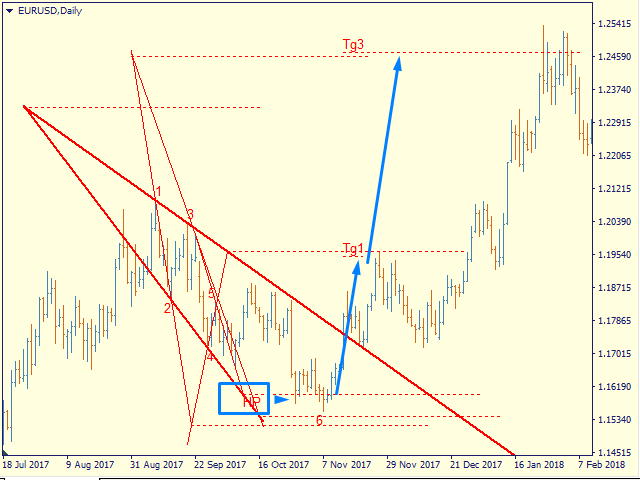
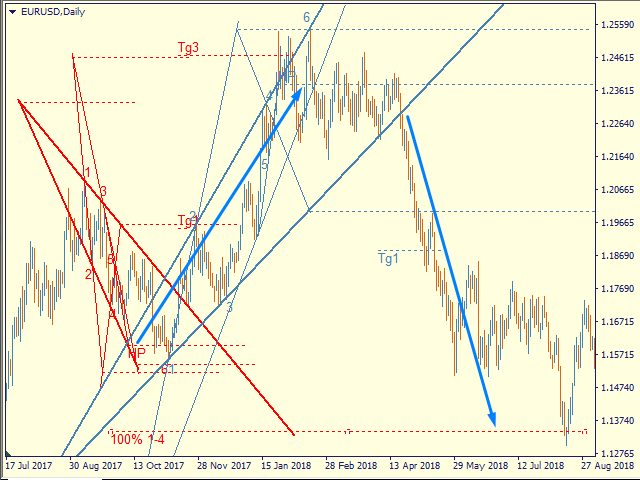
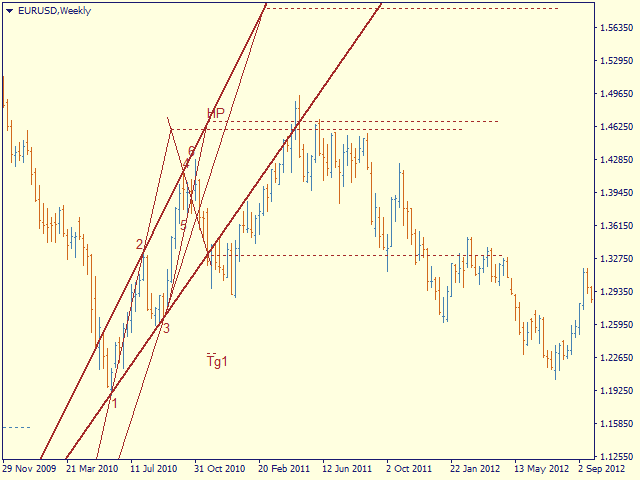
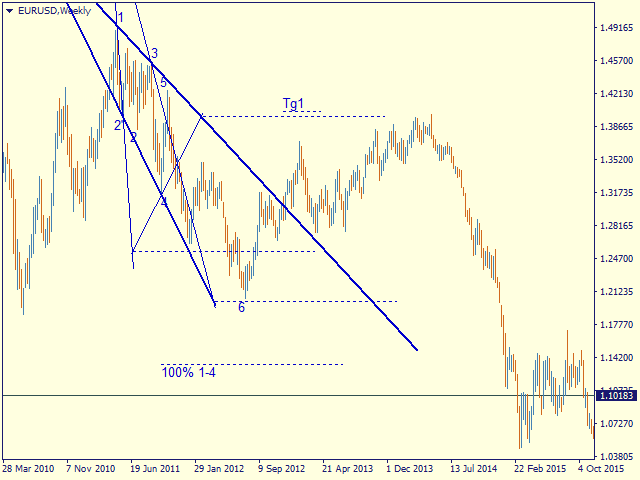
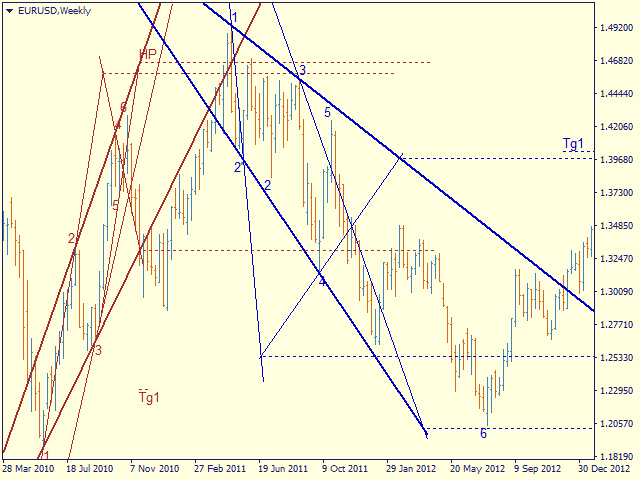
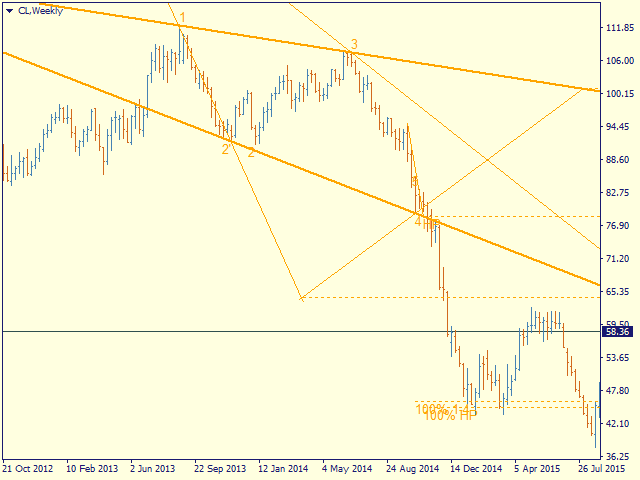
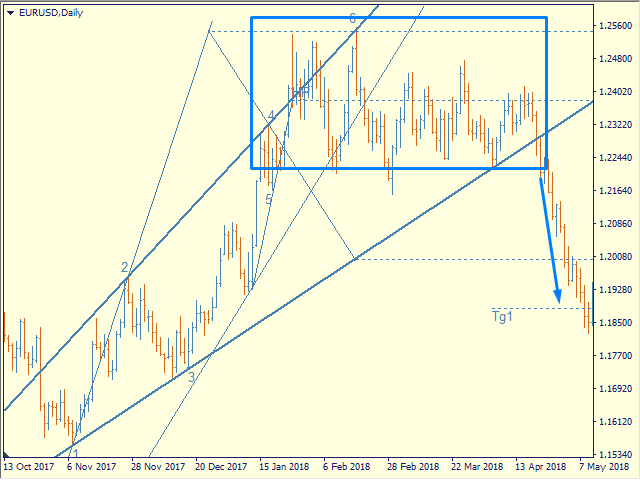
This model is based on the Expansion Model from Adversa Tactics. Designed to determine the trend and predict possible levels and targets of price correction in the future.
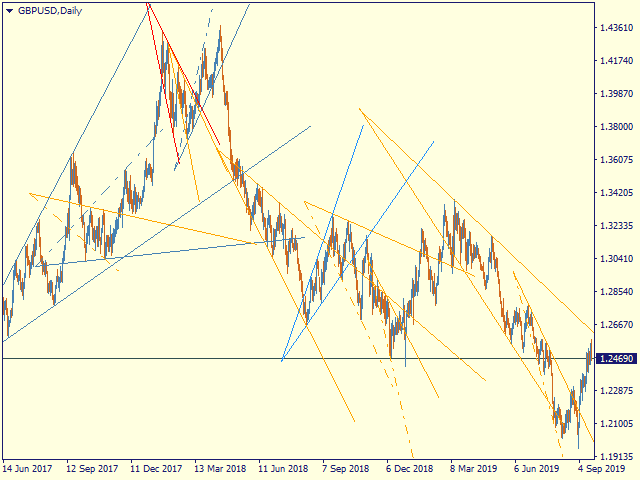
The model describes a developing trend.
The trend is relevant until the price crosses the trend line of the model in the opposite direction.
Levels of rays of the pentagram, level of HP, distances of 100% and 200% of the distance between points 1-4, levels of HP are possible levels of correction or the end of the trend.
If the HP level is consistently reached, a rollback to t4, t5, the trend line followed by a breakout, successive achievement of the target levels tg1..tg5 is expected.
Options
- = indicator = - - general
ChartType - the way of building models - by Close or by High / Low (line chart or Japanese candlesticks)
MaxBarsToCalculate - history depth for markup by models
Select New Model - select or not new models
Font size for price labels - font size for price labels at model levels
Font size for point labels - font size for numbering model points
--= Configure Alerts =-- — Configure Alerts
Enable Alerts — general switsh
Alert1..Alert5 — select up to 5 diffirent events
PopUp Alert — enable popup
Email Alert — enable email, required set up mail in the terminal
Push Notifications Alert — Allow replies to mobile terminals, requires allowance for Push messages in the terminal settings
Alert Sound — enable sound
--= Model's Rules =-- — setting model parameters
Bars for point 4 — number of bars to fix the reference point 4
Enable 4' in model — enable construction on tangent point 4
Minimal Base (1-3), bars - the minimum allowable size of the model base (distance between points 1 and 3)
Maximum Model size (1-4) - the maximum allowable size of the model (distance between points 1 and 4)
LT length in CP-4 - the length of the trend line on the chart in CP-4 units - the distance between the sacral point and point 4
Max distant CP from 1 in 1-3 - the maximum allowable removal of the sacral point, at which the model can still be considered expanding
- = Color Scheme = - - color scheme of models depending on the location in the trend
clrUpTrend - upward pattern from the beginning of the trend
clrDnTrend - a descending pattern from the beginning of a trend
clrUpCorrection - correctional model
clrDnCorrection - - // -
clrUpContinuation - continuation model
clrDnContinuation - - // -
- = Graph Options = - - display of levels
Always Show 100% 1-4 - 100% 1-4, the distance between points 1 and 4 of the model deferred from point 4
Show_Tg1_100 - 100% 1st target
showTg3 - goal 3
showTg4 - target 4
showTg5 - target 5
- = Control bars = - - display of control points
showLinkBar , showBreakLT , showLastBar, showPiclose - experimental points, disabled by default
Controlling the display and detail of models
You can select the model of interest by clicking the left mouse button
1st click - the model is highlighted with bold lines
2nd click - display model details, price labels, control points
3rd click - deselect
Hotkeys
S - hide / show models, except selected ones
> - highlight the next model
< - select the previous model
ESC - cancel all selections