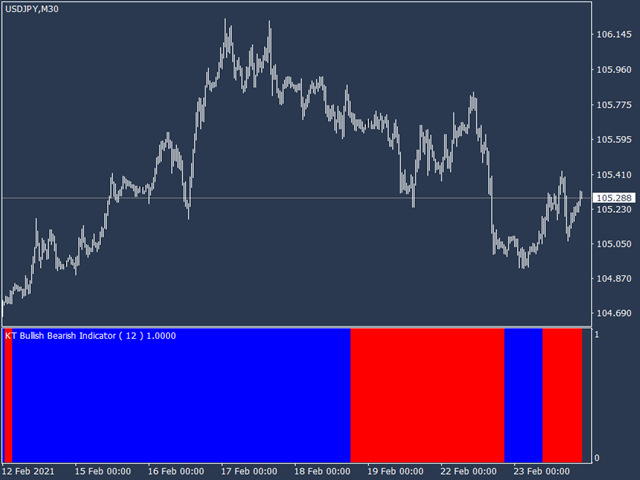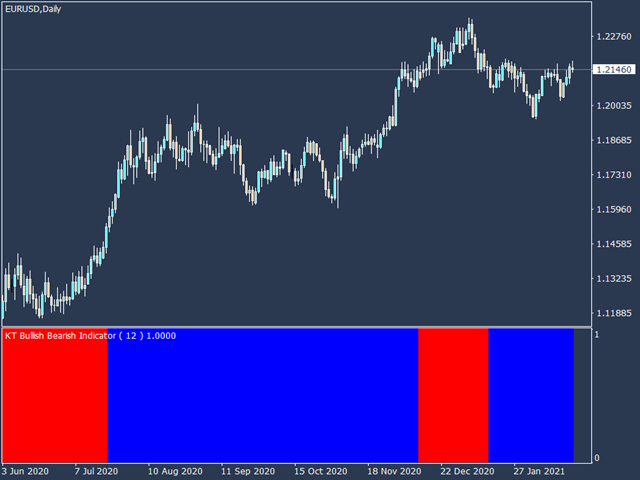
KT Bullish Bearish shows the bullish/bearish regime of the market in the form of a colored histogram representing both of the market states alternately.
Bull Market (Blue Histogram): A bull market indicates an uptrend when an instrument price rises over a continued period like days, months, or years.
Bear Market (Red Histogram): A bear market indicates a downtrend when an instrument price rises over a continued period like days, months, or years.
Applications
- It prevents trading against the big players in the market.
- Only long trades are preferred during the bullish histogram.
- Only short trades are preferred during the bearish histogram.
- It helps to improve the success percentage of trend following strategies.
- Prevents over-trading.
Building a Trading System
You can combine this indicator with various entry indicators to design a complete trading system. For example, you may use a breakout or divergence indicator to find the trading opportunities and filter them using the KT Bullish Bearish to improve its success rate.