Info: marcobarbosabots
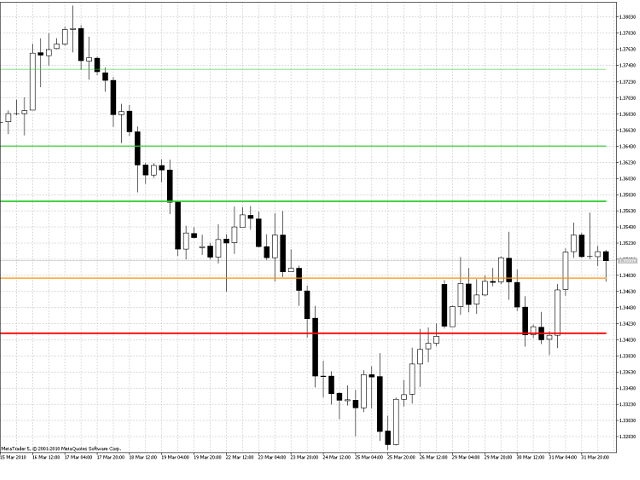
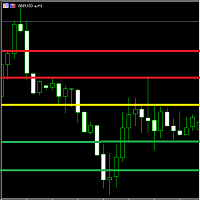
Pivot lines are an easy way to see market trend. The indicator provides the pivot line and three first support and Resistance lines.
Calculations used was:
Resistance 3 = High + 2*(Pivot - Low)
Resistance 2 = Pivot + (R1 - S1)
Resistance 1 = 2 * Pivot - Low
Pivot point = ( High + Close + Low )/3
Suport 1 = 2 * Pivot - High
Suport 2 = Pivot - (R1 - S1)
Suport 3 = Low - 2*(High - Pivot)
You can use the calculated values on an EA too, just make sure the indicator is attached to your chart and use the following formula in your EA code:
// --------------------------------------------------------------------//
// Using Pivot Lines Indicator Calculations //
//---------------------------------------------------------------------//
// Discovering the Indicator Handler
int IndicatorHandler = iCustom(NULL,0,"pivot");
// Creating the arrays
double pivot[],r1[],r2[], r3[],s1[],s2[],s3[];
// Copying data into arrays
CopyBuffer(IndicatorHandler,3,0,3, r3);
CopyBuffer(IndicatorHandler,2,0,3, r2);
CopyBuffer(IndicatorHandler,1,0,3, r1);
CopyBuffer(IndicatorHandler,0,0,3, pivot);
CopyBuffer(IndicatorHandler,4,0,3, s1);
CopyBuffer(IndicatorHandler,5,0,3, s2);
CopyBuffer(IndicatorHandler,6,0,3, s3);
// Printing the values
Print("R3 value: ", r3[0]);
Print("R2 value : ", r2[0]);
Print("R1 value : ", r1[0]);
Print("Pivot value : ", pivot[0]);
Print("S1 value : ", s1[0]);
Print("S2 value : ", s2[0]);
Print("S3 value : ", s3[0]);
// --------------------------------------------------------------------//