VIDEO and PICTURES show 3 waves indicator has been updated to 5 waves
Youtube channel: https://www.youtube.com/c/TradeTheVolumeWavesbyPDiamantopoulos
Videos on Wave Anatomy: https://www.youtube.com/playlist?list=PLXGChDJn8id4SHo_kI3O0MRLSM4YlELtYWave Anatomy
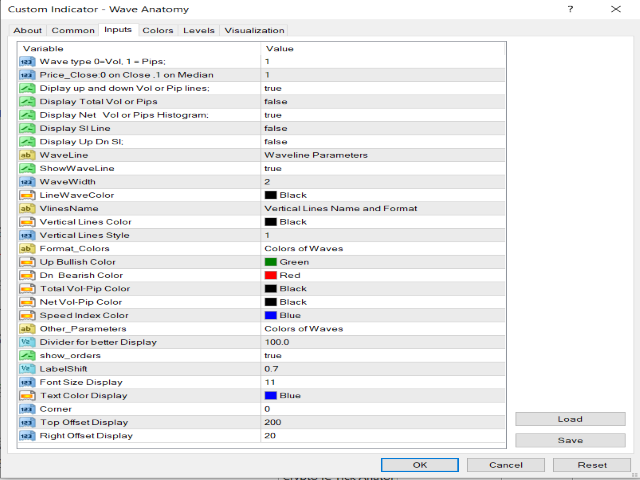
Constructing you own 5 Waves has never been easier!!!
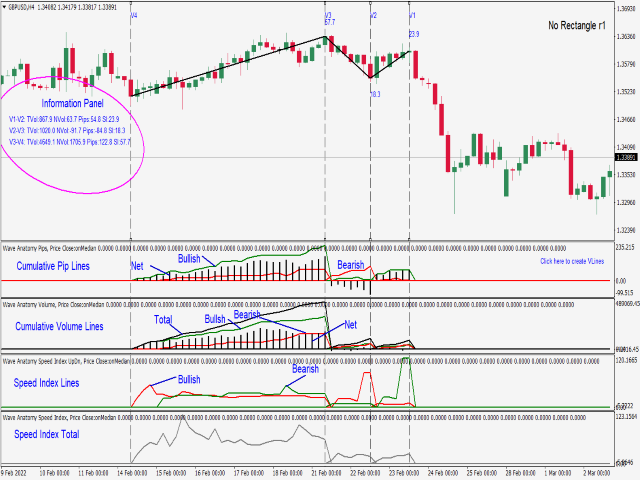
This indicator is based on Wyckoff’s, David’s Weis and my Speed Index Theory. This indicator will you help analyze what is happening in 5 Price Waves that you can construct yourself. This tool is designed for scalpers and swing traders and will help them to analyze any wave on any timeframe at the same time. Furthermore, this tool is very useful to Elliot wave traders trying to identify wave numbering and turning points.It can be used on any kind of chart and instrument that has price, volume and time like regular timeframe charts, tick charts (constant volume charts), renko and range bars.
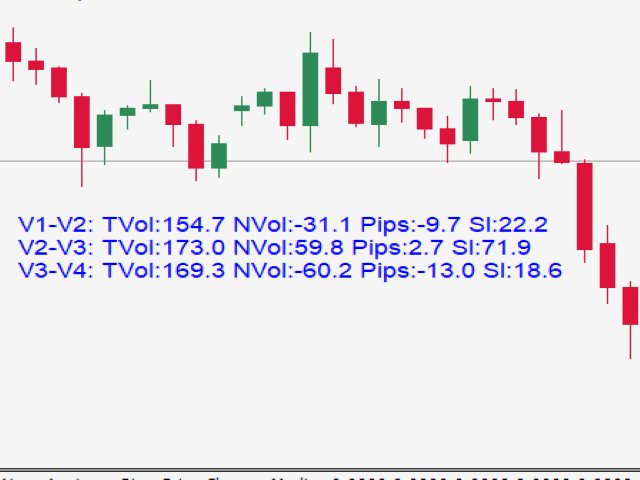
The information provided by this indicator will give you an edge to understand when price has difficulty moving as well as ease of movement. Comparing the cumulative pip lines with the cumulative volume lines in combination with Speed Index will provide you a better understanding why Price moved in one or the other direction.
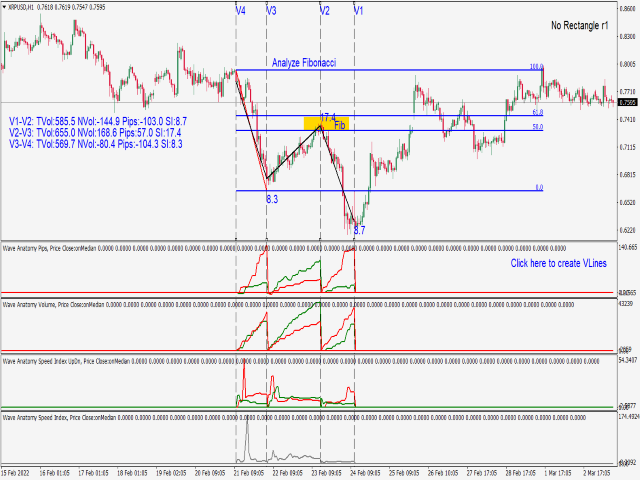
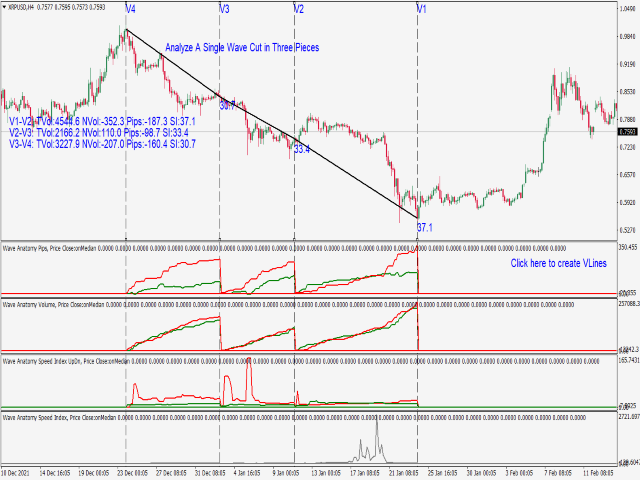
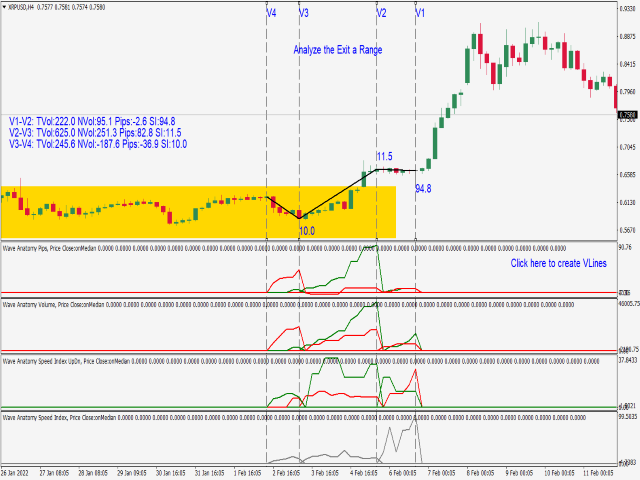
Examples of Wave Structure Analysis that this tool can be used are shown on the attached charts and the videos.
- Analyze Fibonacci Retracements
- Analyze Exit From Range
- Analyze A Single Wave Cut in 3 Pieces
- Analyze Elliot Waves
Contact me at tddevel@tradethevolumewaves.com after your purchase to provide you with the manual.