The indicator paints the candlesticks in colors of volumes depending on the market situation. Along with candlestick coloring, you will receive alerts in the form of a regular alert.
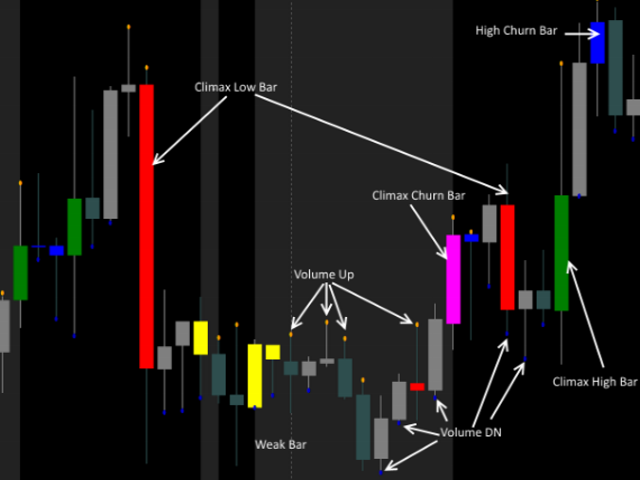
- Red candles indicate the end or beginning of a downtrend or the end of a correction during an uptrend.
- Green candles mean the beginning or end of an uptrend or the end of a correction during a downtrend.
- Yellow candles represent the lack of interest on the market and a possible beginning of a flat.
- Blue ones have an above-average volume and a below-average candle size, which is typical for the end of the trend or for strong support/resistance levels. They are also called "squat" bars.
- Purple candles indicate a rapidly increasing volume and size. They occur when the flat boundaries are tested, albeit rarely.
- Yellow dots above a candle High means that its volume is lower than that of the previous one, while a blue dot under a Low indicates a volume lower than the previous one.
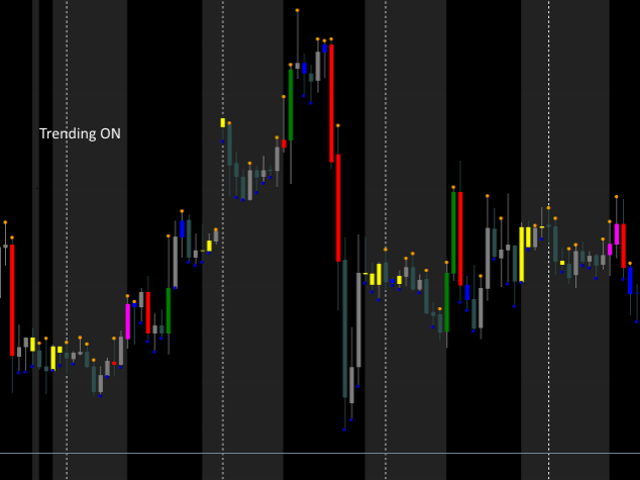
- Gray areas marks the zones where the volumes are below the average, defined by the 'MAPeriod' parameter.
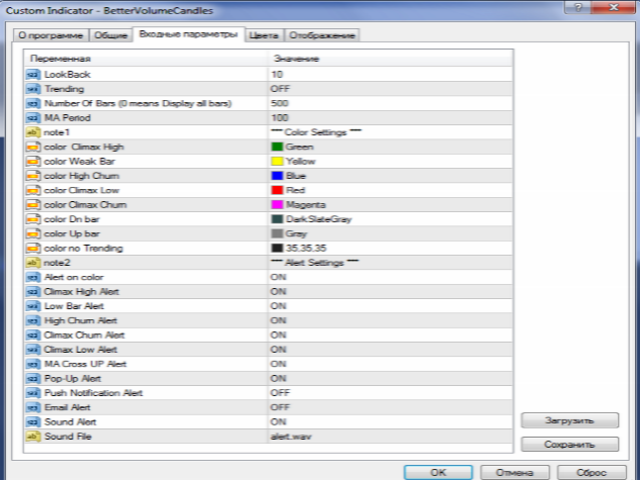
Settings
- LookBack - the number of bars to compare.
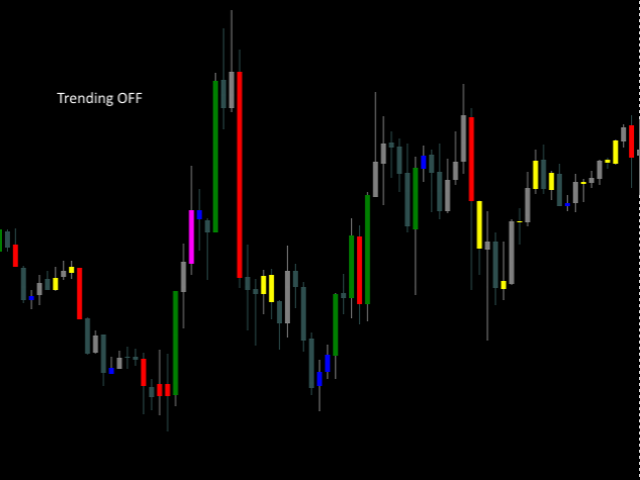
- Trending - additional analysis.
- Number Of Bars - the number of bars for calculation. If 0, all bars in history.
- MA Period - period for calculation of the average volume.
Color Settings - bar coloring.
Alert Settings
- Alert on color - alerts for color change.
List of possible alerts (Alert on color – ON)
- MA Cross UP Alert - alert if the UP volume is higher than the average value defined by the 'MA Period' parameter. Does not depend on 'Alert on color'.
- Pop-Up Alert - alert in a pop-up dialog box.
- Push Notification Alert - push notification.
- Email Alert - Email notification.
- Sound Alert - sound only (Alert on color - OFF).
- Sound File - name of the sound file.