 Automatic calculation and marking of resistance and price reversal levels. The script will perform statistical calculations and plot a regular grid on which the quote moves on the graph. These levels are very stable. Use them in trading planning and for placing pending orders.
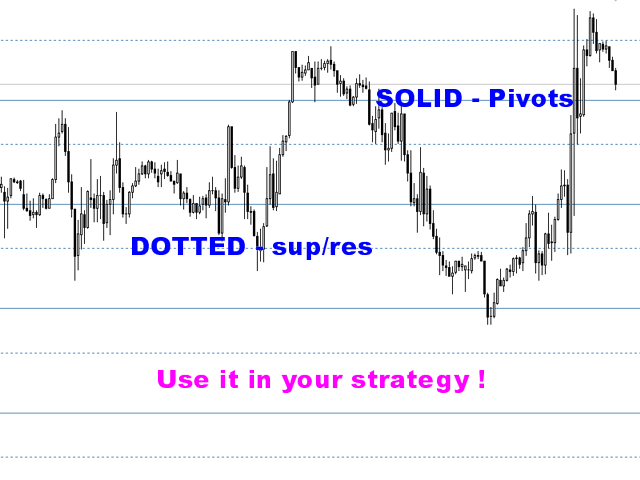
Just select a timeframe and AutoLevels will indicate the important places of the chart in the form of horizontal lines.
Solid lines indicate more "dense" areas - areas of price reversal, where the quote happens more often.
Dotted lines indicate "voids" - support/resistance levels, there is a quote less often.
The typical difference between "dense" and "voids" areas is 8-12%
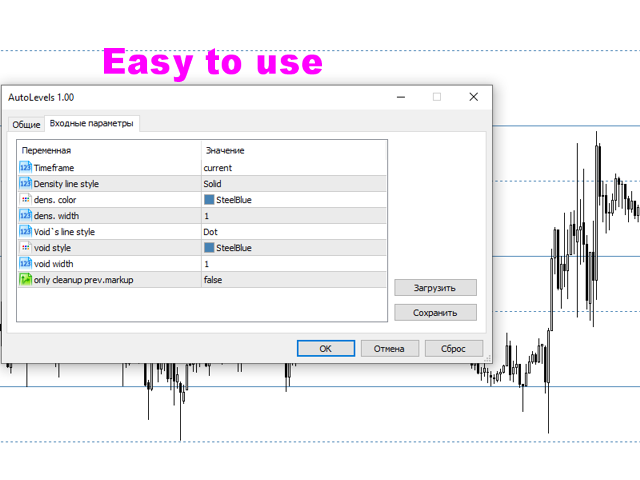
The parameters are as simple as possible - specify the timeframe (the current one by default) and the styles for drawing levels.
Well good luck!