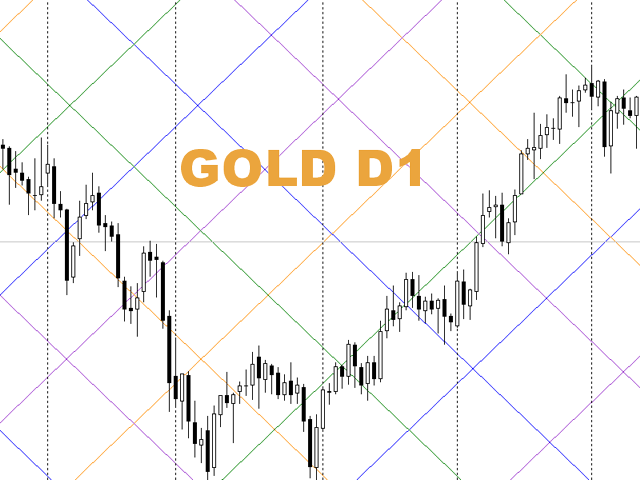
 The script statistically reveals the main rate of movement (Gan angle) for the selected instrument.Using mathematical methods, it determines the speed of following the candles of the current timeframe against the background of the older one.Just place AutoGan on the graph and it will perform the required calculations and correctly draw the Gan grid.
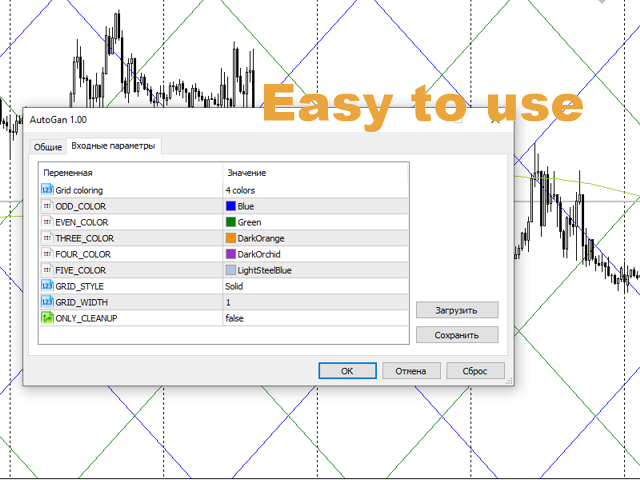
The script is very easy to use, only the colors of the grid lines are set in the parameters.
Parameters:
GRID_COLORING : How many colors to use when coloring the Gan grid. By default, 4.
ODD_COLOR, EVEN_COLOR,THREE_COLOR,FOUR_COLOR,FIVE_COLOR: set alternating colors for grid lines
GRID_STYLE: line style
GRID_WIDTH: the thickness of the lines.
and an additional parameter ONLY_CLEANUP-allows you to simply delete all the plots from the graph.
After running, the script performs lengthy calculations, calculates the angle of rotation, positions and displays the grid.
Best regards !The received values are displayed in the log.
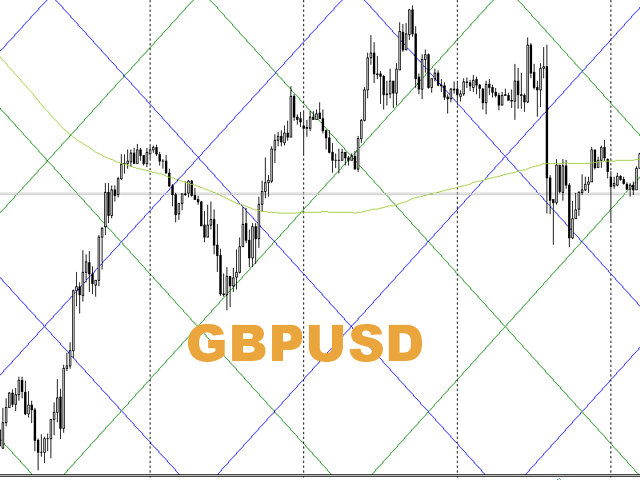
Do not be surprised that different values are obtained for different timeframes - the bars of different timeframes follow, although close, but different angles.
And even more so different tools
Specific bars almost never coincide with the estimated (150 years ago, in other conditions and in other markets) 1 point per 1 minute bar.
Statistics confirm the presence and the enormous role of linear motion and the presence of constant angles and the Gan grid. Just different values.