Trades Viewer is a trading helper app for a serious trader. It offers several important data like day range, 22 days average range and predefined PL. It draws trades history and current open positions on a chart. It has a detail panel for viewing a particular trade with just a click on that trade. All these make it very convenient and straightforward to view your entry/exit positions and thus improve your trading system.
Features
- Profit/loss of the current symbol, counting all trades of the symbols and their swaps.
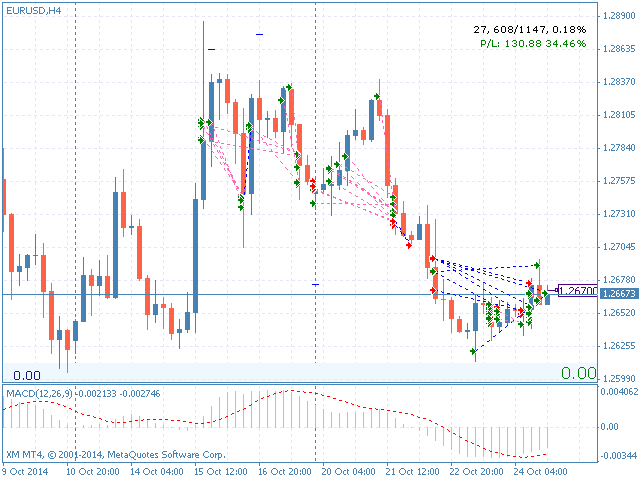
- Overall profit/loss across symbols.
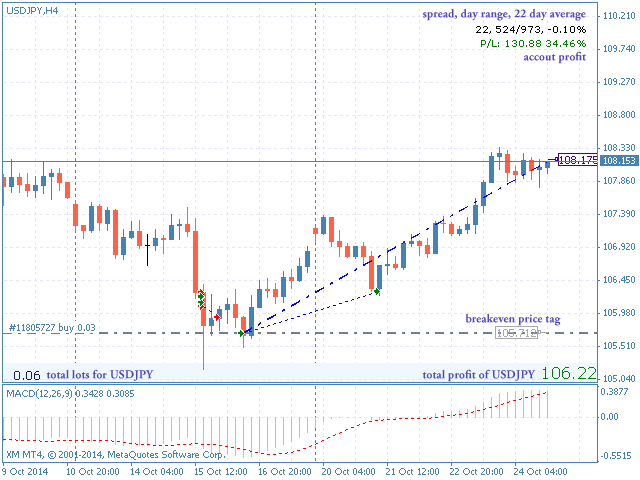
- The current spreads.
- Day range, day percentage and 22 days average range.
- Top profit (the profit if all trades of the current pair hit T/P).
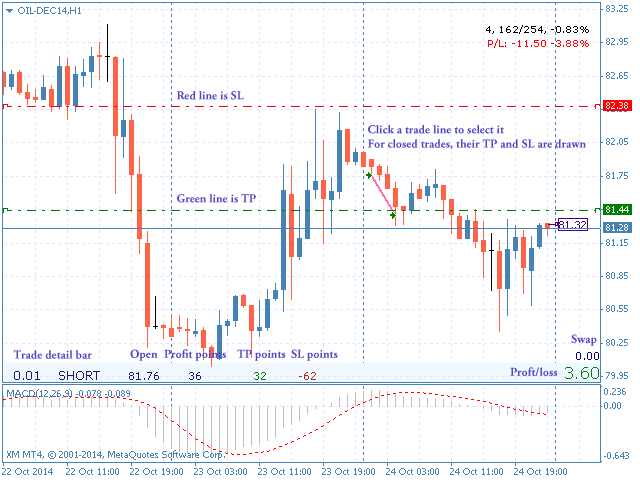
- Top loss (the loss if all trades of the current pair hit S/L).
- Top profit/loss ratio.
- Total lots of the current symbol. If you have a 0.2 lot long and 0.5 lot short, then your total lot is -0.3 .
- Display ask price in a price label.
- Display breakeven price for the current symbol in a price label.
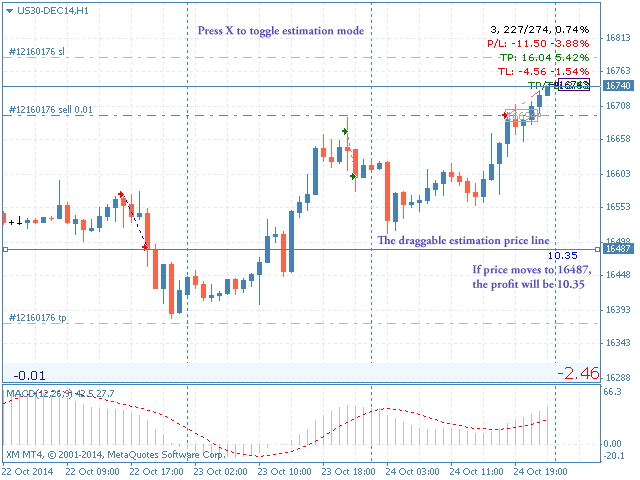
- Calculate profit/loss for the current symbol with a draggable price estimation line. Press X key to toggle the estimation line.
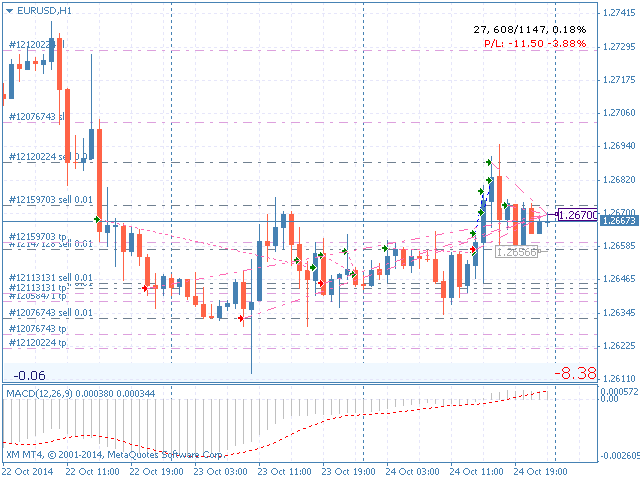
- Putting the current open trades on the respective charts.
- Putting trading history on the respective charts.
- Quick time change with keyboard shortcuts (1,2,3,4,5)
Usage
- To use, just attach this indicator to any chart.
- Trading history comes from Account history tab in Terminal. So typically you would choose All History .
- Click on a trade line (whether open or closed trade) to select that trade, letting you see its detail like type, size, swap, profit/loss and SL/TP in points. Press Esc to unselect.
- When no trade is selected, the trade detail bar displays information about the total trades of the current symbol.
Keys
- Change timeframe:
5 min: Key 1
1H: Key 2
4H: Key 3
1D: Key 4
1W: Key 5
- Select latest trade: Key /
- Unselect trade: Key Esc
- Toggle price estimation mode: Key X (drag the line to see the P/L when the price reaches there)
- Toggle chart elements: Key D (gives you a clean chart)
Color Representation
- Red arrow of a trading line: a losing trade
- Green arrow of a trading line: a winning trade
- Red trading line: a short trade
- Green trading line: a long trade