The Universal Dashboard is a tool for multidimension technical analysis of the market. It allows you to collect a customizable set of trading signals and important performance indicators, and display them in a single table.
Multiple symbols, timeframes, and conditions can be monitored and alerted at once. The conditions are specified as expressions which support all built-in indicators, custom indicators, math functions, arithmetic operators and more.
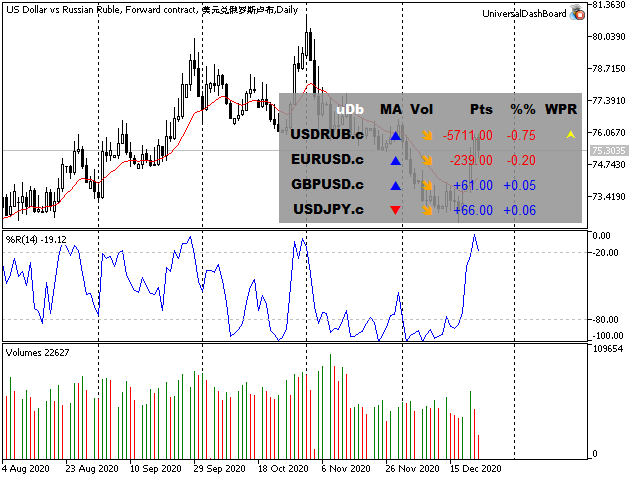
The dashboard is implemented as a non-trading expert adviser. It displays a table with columns and rows, filled according to the settings. On each axis (horizontal X and vertical Y), EA iterates through elements of the same kind:
- Symbols;
- Timeframes;
- Signals;
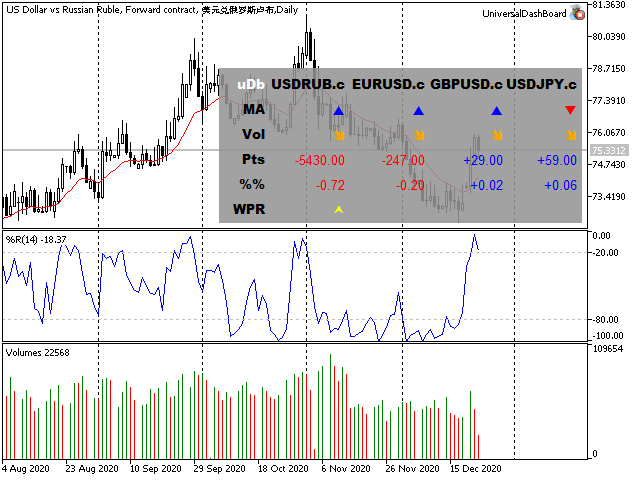
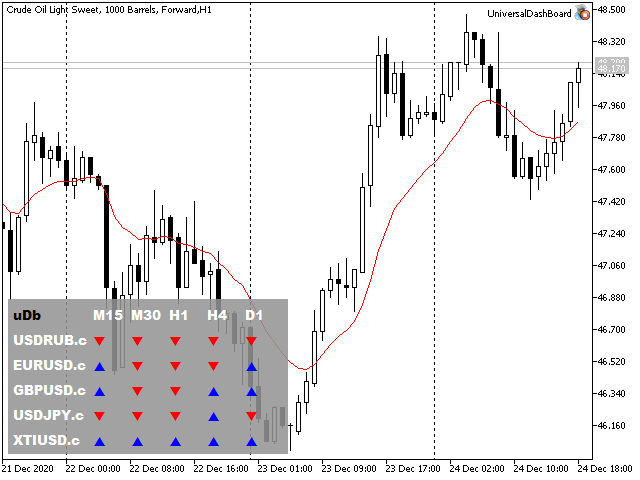
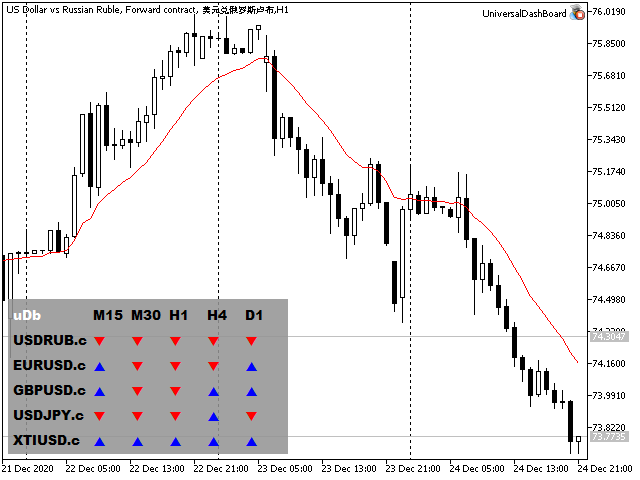
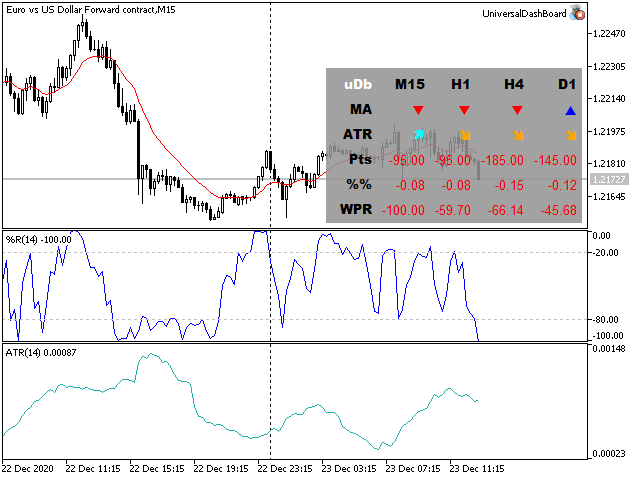
For example, you may see direction of a specific MA setup for all combinations of provided symbols and timeframes, or different trading signals (such as overbought/oversold states, price change percent, range breakout, etc) for a list of selected symbols (on the same timeframe), or otherwise these signals can be viewed for a list of selected timeframes (for the same symbol).
Both axes must be setup to display different kinds of objects. The element of the 3-rd kind which is not selected for neither X nor Y must be a single one. This is because the table has 2 visible dimensions, and hence one of virtual dimensions Symbols/Timeframes/Signals should have a fixed value.
Parameters
Main Settings
- Xaxis - elements to display on the horizontal axis;
- Yaxis - elements to display on the vertical axis;
- WorkSymbols - a comma separated list of symbols to iterate through, if Xaxis or Yaxis is chosen to show Symbols; empty by default means the single current symbol;
- WorkTimeframes - a comma separated list of timeframes (for example, "M15,H1,D1") to iterate through, if Xaxis or Yaxis shows Timeframes; empty by default means the single current timeframe;
- RefreshSeconds - number of seconds to recalculate the table; 0 means once per bar;
Display Settings
- Corner - a chart corner to anchor the table, right lower by default;
- Gap - size of margins in the table cells, in pixels;
- FontSize - font size;
- DefaultFont - font name for values, Arial by default;
- DefaultFontBold - font name for column and row labels, shown in bold, Arial Black by default;
- PictogramFont - font name for signal marks, Wingdings by default;
- Format - format string for values ( the syntax );
- DefaultColor - color for values (if neither positive or negative colors specified), none by default means default foreground color of the chart;
- DefaultColorPlus - color for positive values;
- DefaultColorMinus - color for negative values;
- BackgroundColor - table color;
- BackgroundTransparency - table transparency, 0 ( transparent ) - 255(opaque);
Work Indicators and Signals
- IndicatorHint - a drop down list with hints of supported standard indicators;
- Indicator[01-20] - 20 lines to specify indicators used to calculate signals; each one can be either a standard indicator or a custom indicator; the syntax is "name(parameter,parameter,...)", for example, "iMA(14,0,ema,close)";
- Signal[01-20] - 20 lines with trade signal conditions/expressions; for example, "markPN(iMA01(0,0)-iMA01(0,1))" will place Positive/Negative marks (for all configured symbol/timeframe pairs) depending from the MA direction on the last bar;
- SignalLabels - an optional, comma separated list of signal labels;
Visual Marks
- Positive, Negative, Rising, Falling, Filled, Blank, Custom1, Custom2 - char codes from fonts like Wingdings for specific events, when conditions of the work signals are met (meaning of every mark is up to you);
- Color[A..Z] - colors for the marks;
In the expressions, indicator calls are identified by indices in the input group. For example, you may have 2 MAs with different settings in Indicator01 and Indicator02. Then to reference them use the names iMA01 and iMA02 correspondingly. If a name of an indicator is too long, you may use the shorter notation IND01, IND02, etc. After the name of an indicator there must be parentheses with 2 numbers: buffer number and bar number. For example, the expression "IND01(0,1)" will output a value from 0-th buffer, and 1-st bar (note that the current, latest bar has the index 0).
Please find more details and examples in the blog .