You ask yourself the question every time you open your charts: how to win in trading? Will using a lot of indicators work? well know that I also asked myself the same questions when I first started trading. After testing many indicators, I realized that winning trading is simple and accurate trading. after several months of thinking and optimizing I was able to find my solution: Candle Good Setup
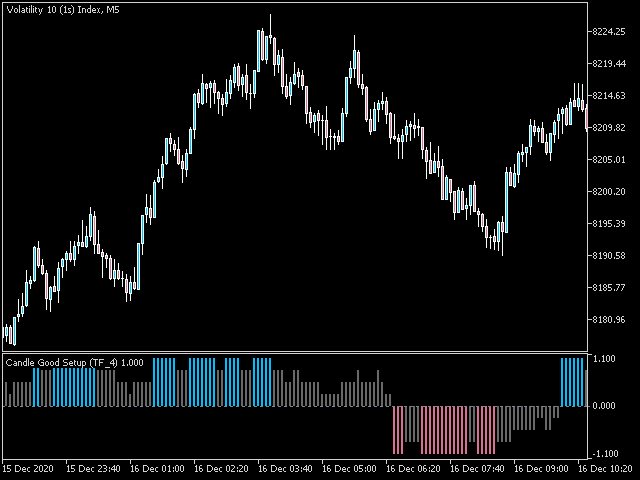
Candle Good setup is a trend and entry timing indicator analyzing the market in multi-frame to give the right timing to enter and exit the market.
Advantages You Get
Easy, visual and effective trend detection.
Gives you the ability to filter and further improve your trading strategies.
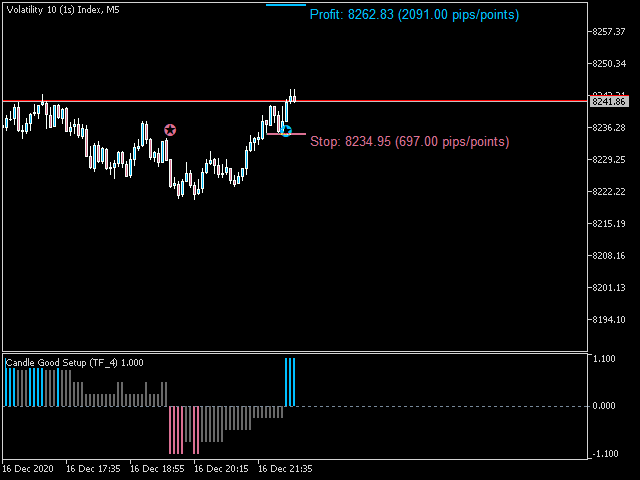
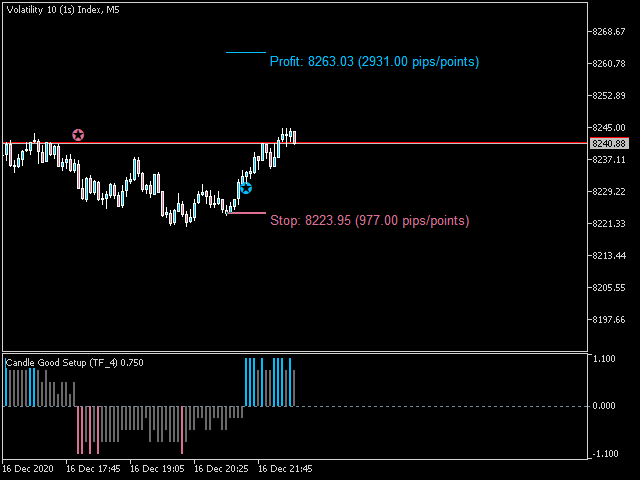
shows your stop loss and take profit according to your settings
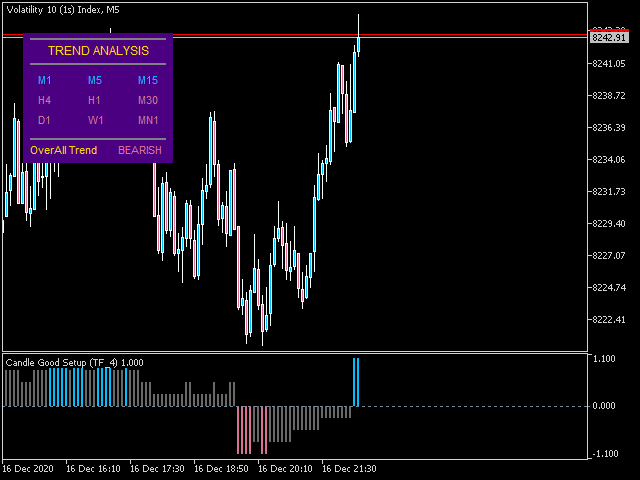
Dashboard for Check trend in keys timeframes ( M1-M5-M15-M30-H1-H4-D1-W1-MN )
Never repaints, never back paints, never recalculates.
Signals strictly on the "Close of the bar".
Works in all symbols and all timeframes.
Integrated pop-up, email, push notification and sound alerts.
Fully compatible with Expert Advisor (EA) development.
How To Trade
We can imagine several trading strategies with this wonderful indicator. I will introduce you in the following lines how I use it personally
No complicated rules, Just follow 4 simple steps!
Step 1: Trade Setup
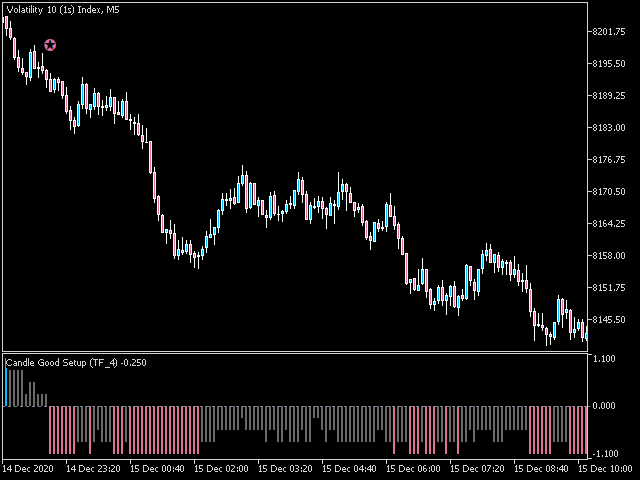
Note the trend indicated by the indicator
Step 2: Enter Setup
Enter sell if in a downtrend and the indicator turns from neutral to the sell signal
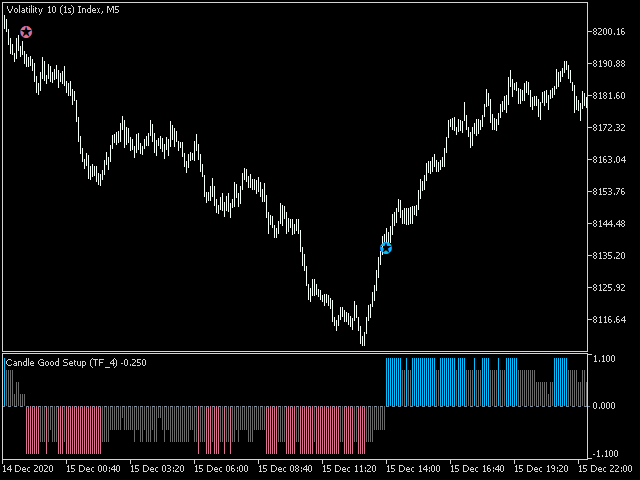
Enter Buy if in an uptrend and the indicator changes from neutral to the buy signal
Step 3: Set Stop Loss and take profit
set the stop loss and take profit at the level indicated according to your parameters
you can define partial take profit to properly manage your position
Step 4: Early exit
Immediately exit the trade if the trend changes
Candle Good setup options and settings
Main settings
Candle Mode : choose the type of candlestick use analysis (Japanese candlestick or Heiken Ashi candlestick).
Time Frame Analysis : choose the number of timeframes for the analysis (2 - 3 or 4 timeframes).
Display settings
Show Arrow -> Set "true" to materialize the trend with a drawing in the main window.
Show Dashboard -> Set "true" to display the dashboard (trend scanner) in the main window.
Show SL and TP-> Set "true" to display the stop loss and take profit level in the main window.
Candle period for SL -> number of bars to position the stop loss
RiskReward -> Risk Reward ratio for take profit
Colors settings
Down color -> Color of drops
Up color -> Color of the supers
SL line color -> Stop loss line color
TP line color -> Take profit line color
Alert and notification settings
Popup Alerts -> Set "true" to receive pop-up alerts
Email Alerts -> Set "true" to receive a notification e-mail
Push Notification Alerts -> Set "true" to receive mobile notifications
Sound Alerts -> Set "true" to receive an audible notification
SoundFileName -> Choose your favorite alert sound
Graphs limit settings
Limit Bars -> maximum of bars for the first calculation