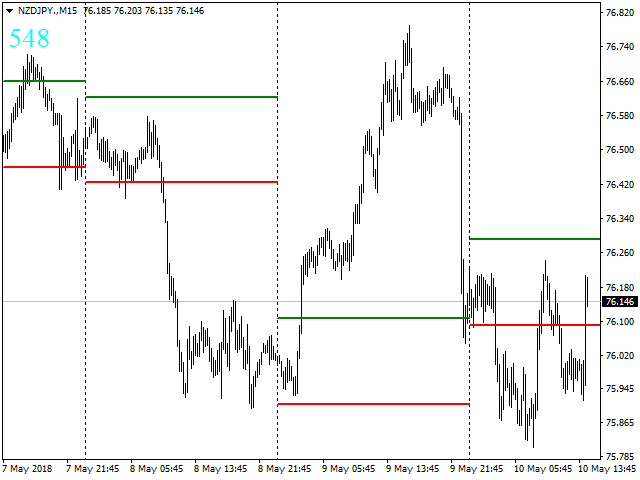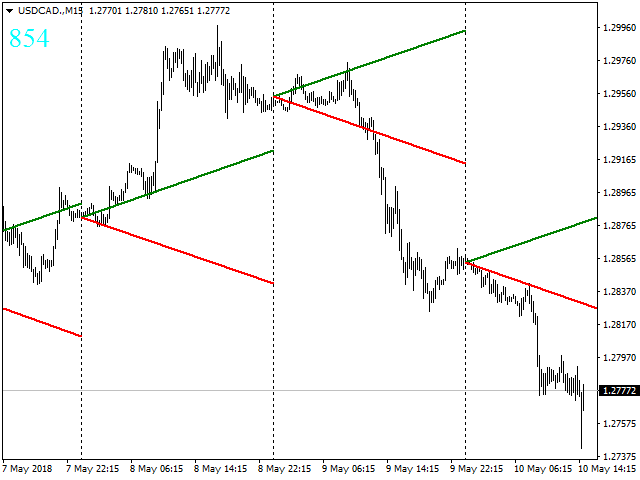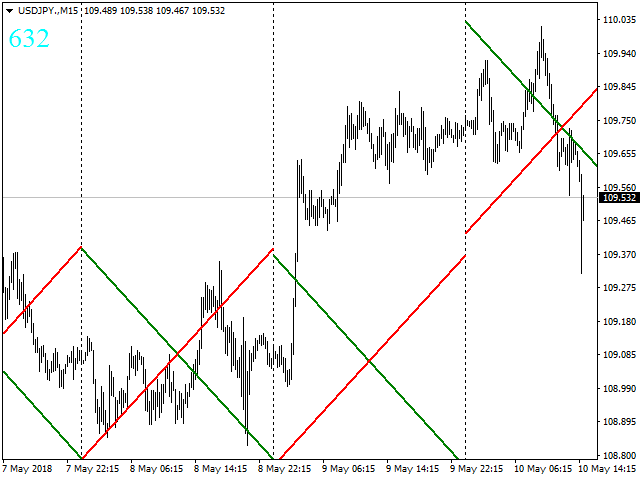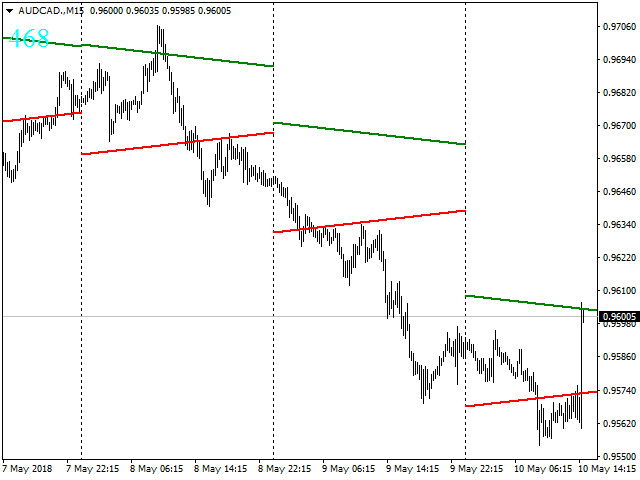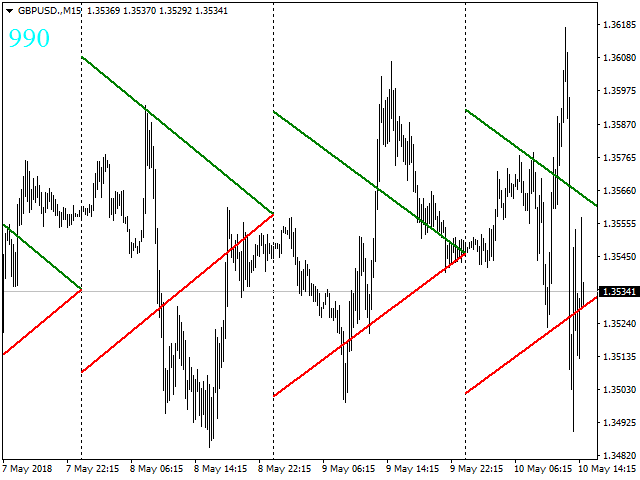
IntradayTrack displays daily support and resistance lines based on the average symbol volatility for a certain period. You can tilt the line to a certain angle both at the beginning and the end of a trading period.
Parameters
- Track period - the period of drawing lines (day, week, month)
- Avg price range – number of days the average volatility is considered for
- Start value (Avg %) – distance between the lines at the beginning of a trading day in % of the average volatility for a selected period
- End value (AVG %) - distance between the lines at the end of a trading day in % of the average volatility for a selected period
- History – number of last days the indicator is displayed for