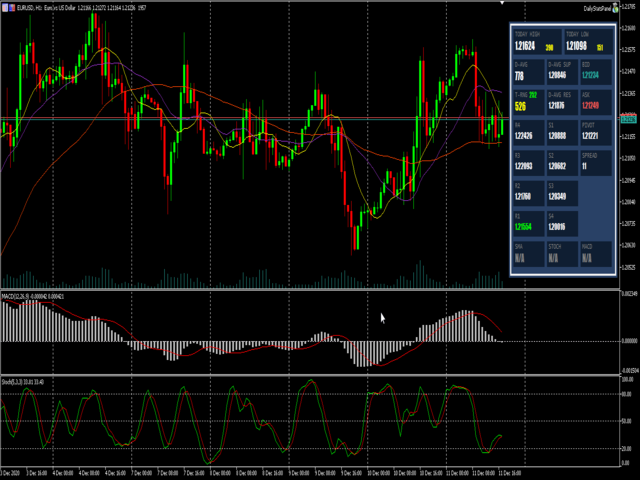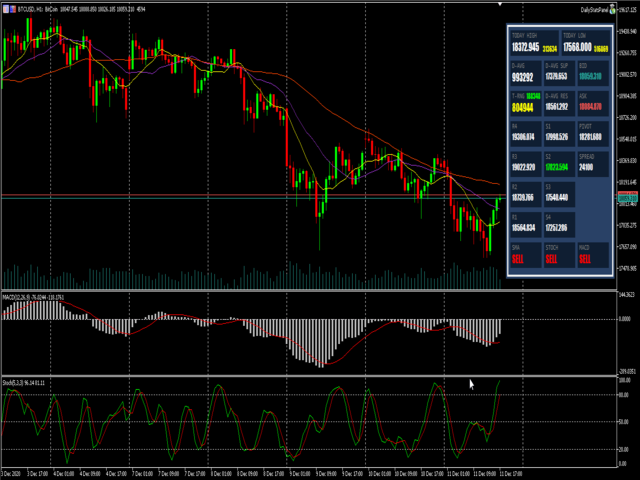
DAILY STATS PANEL is a small panel that shows some statistic of opened chart. For example: Fibonacci resistance and support, daily average moving points and today's moving range, etc.
After applied this expert advisor to chart, a small panel will be shown on the right.
** NOTE: This is not an algo trading expert advisor. **
Input parameters
- show_pivot - Whether or not to show pivot, resistance and support line on the chart.
- Pivot Color - R1-R4, Pivot and S1-S4 horizontal line colors.
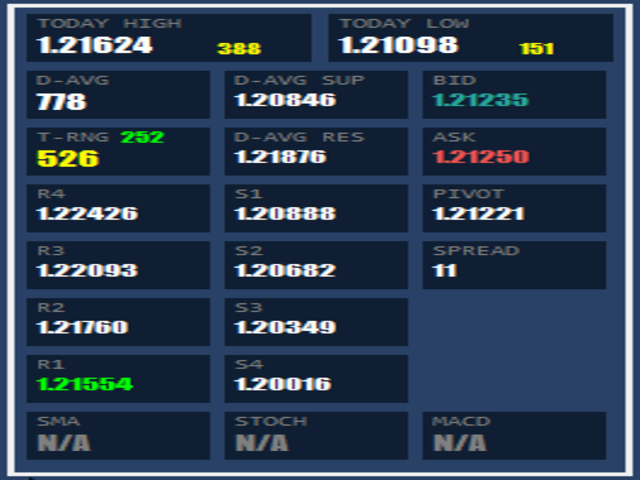
Statistics shown on panel
** NOTE: All price points based on your system's points. **
- TODAY HIGH:
- Value on the left indicates HIGH price based on D1 timeframe.
- Value on the right indicates number of points BID price away from today's HIGH .
- TODAY LOW:
- Value on the left indicates LOW price based on D1 timeframe.
- Value on the right indicates number of points ASK price away from today's LOW .
- D-AVG:
- Daily average moving points based on past 30 days daily average moving points.
- Number of moving points for individual day is calculated by today's HIGH minus today's LOW .
- T-RNG:
- Big value indicates today's moving points. Calculated using today's HIGH minus today's LOW .
- Small value indicates remaining points from T-RNG to D-AVG.
- D-AVG SUP:
- Average support line of the day. Calculated using today's HIGH minus daily average.
- D-AVG RES:
- Average resistance line of the day. Calculated using today's LOW plus daily average.
- BID:
- Current BID price.
- ASK:
- Current ASK price.
- PIVOT:
- Fibonacci pivot line.
- R1 - R4:
- Fibonacci resistance 1 to resistance 4 line.
- S1 - S4:
- Fibonacci support 1 to support 4 line.
- SPREAD:
- Spread of the symbol.
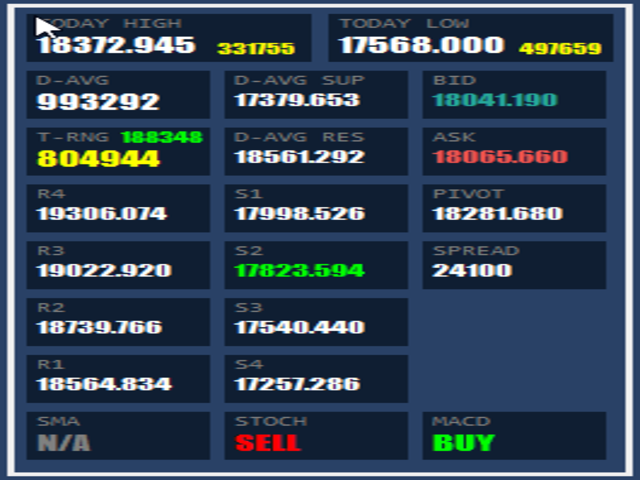
- SMA:
- Value show BUY when SMA10 (Simple Moving Average) is higher than SMA20 and both SMA10 and SMA20 is higher than SMA50 .
- Value show SELL when SMA10 is lower than SMA20 and both SMA10 and SMA20 is lower than SMA50 .
- STOCH:
- Value show BUY when stochastic main and signal is below 20 (Oversell).
- Value show SELL when stochastic main and signal is above 80 (Overbought).
- MACD:
- Value show BUY when MACD main and signal is above 0.
- Value show SELL when MACD main and signal is below 0.