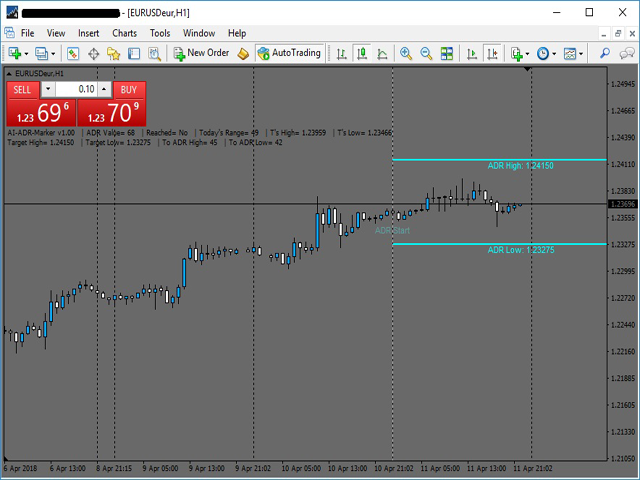
The
Average Daily Range
shows the dynamic levels of
average pip range
on a pair measured based on the daily Highs and Lows over a certain periods.
You can use the ADR to visualize
potential price action
outside the average daily move. When ADR is above average, it means that the
daily volatility is higher
than usual.
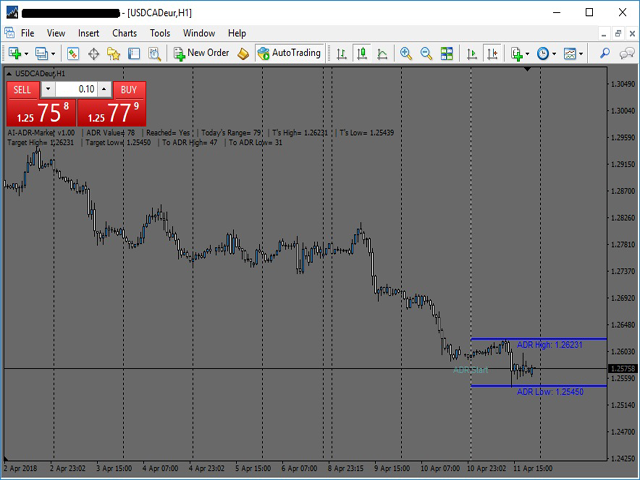
The ADR can be helpful in setting targets for positions. If the ADR shows you that a pair has an average daily range of 80 pips, then it might
be wise to tighten up your target in this range.
ADR Marker is also useful for trading intraday reversals. If a currency pair reaches the top of a daily range, then it could be due for a
reversal, and you could capture a potential retracement.
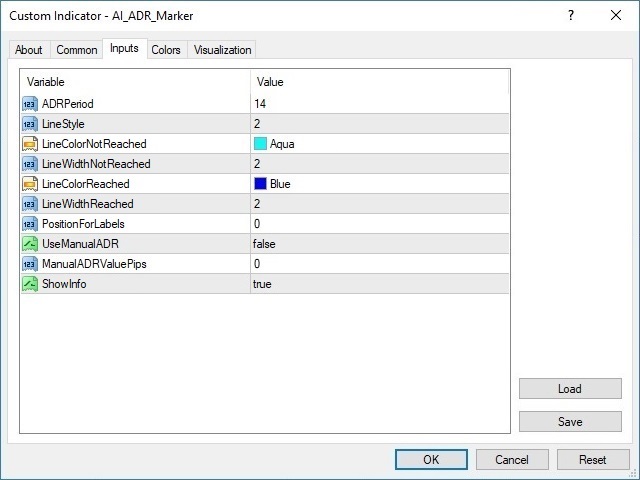
Indicator parameters
ADRPeriod
- calculating the period of average daily range in days (default 14)
LineStyle
- style of the displayed lines (default 2)
LineColorNotReached
- the color of the lines when ADR are not reached (default Aqua)
LineWidthNotReached
- width of the lines when ADR are not reached (default 2)
LineColorReached
- the color of the lines when ADR are reached (default Blue)
LineWidthReached
- width of the lines when ADR are reached (default 2)
PositionForLabels
- position of the price value labels under the lines (default 0)
UseManualADR
- option for usage of manual ADR value(default false)
ManualADRValuePips
- input your ADR value in pips (default 0)
ShowInfo
- display the information text (default true)
How to configure the indicator
The indicator is provided with option for
manual input of ADR
, which allows you to use
your own ADR
value in pips.
If you want to give a try with different settings you can open
Indicator list
, choose
AI_ADR_Marker
and click on "
Inputs
" tab.