The FFx Watcher PRO is a dashboard displaying on a single chart the current direction of up to 15 standard indicators and up to 21 timeframes. It has 2 different modes:
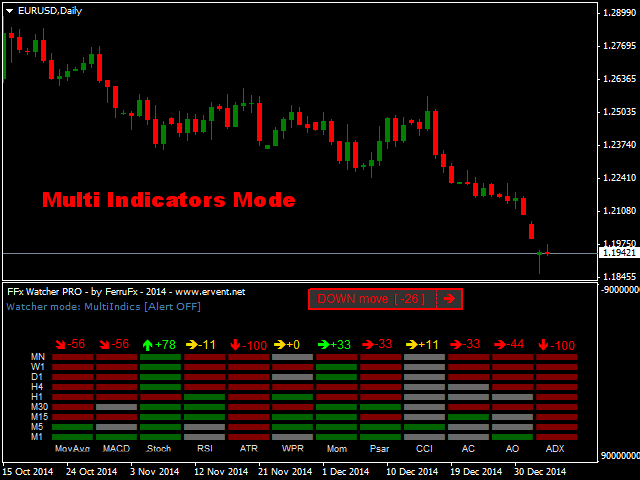
- Watcher mode: Multi Indicators
- User is able to select up to 15 indicators to be displayed
- User is able to select up to 21 timeframes to be displayed
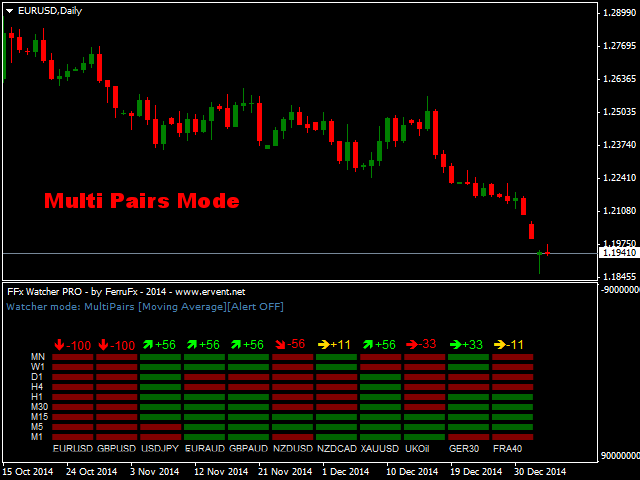
- Watcher mode: Multi Pairs
- User is able to select any number of pairs/symbols
- User is able to select up to 21 timeframes to be displayed
- This mode uses one of the standard indicators selected by User
In both modes, User is able to set each timeframe with a specific coefficient. The purpose is to give more impact to certain timeframes according to User need. An alert (Sound/PopUp/Email/Push) can be set when User's defined level is reach.
Wish you great trading with this tool!
Common User Inputs :
- Watcher Mode : select here the dashboard mode (pairs or indicators mode)
- Signal : select here the candle to be taken into account (current/close)
- Pairs to display : set here the pairs to be displayed (multi pairs mode)
- Timeframes to display : set here the timeframes
- Timeframes impact : set here the impact to give to each timeframe (higher the number, higher the timeframe will be important in the calculation)
- Text/Up/Flat/Down Colors : set here the colors for the dashboard
- Alert Level : set here the level you want to be alerted
- Delay Minutes Between Alerts : set here the minimum minutes between alerts
- Sound Alert : select here to enable the sound alert
- Popup Alert : select here to enable the popup alert
- Email Alert : select here to enable the email alert
- Push Alert : select here to enable the push notification
Indicators Inputs :
- Moving Average
- Display Moving Average : select here use the indicator
- Period : period of the MA
- Shift : shift of the MA
- Method : method of the MA
- ApplyTo : applied price of the MA
- MACD
- Display MACD : select here use the indicator
- FastEMA : fast EMA period of the MACD
- SlowEMA : slow EMA period of the MACD
- SignalSMA : SMA period of the MACD
- Applied Price : applied price of the MACD
- Stochastic
- Display Stochastic : select here use the indicator
- KPeriod : k period of the STO
- DPeriod : d period of the STO
- Slowing : slowing of the STO
- MAMethod : method of the STO
- PriceField : applied price of the STO
- RSI
- Display RSI : select here use the indicator
- Period : period of the RSI
- ApplyTo : applied price of the RSI
- WPR
- Display WPR : select here use the indicator
- Period : period of the WPR
- Momentum
- Display Momentum : select here use the indicator
- Period : period of the Momentum
- ApplyTo : applied price of the Momentum
- PSAR
- Display PSAR : select here use the indicator
- Step : step of the PSAR
- Maximum : maximum of the PSAR
- CCI
- Display CCI : select here use the indicator
- Period : period of the CCI
- Applied Price : applied price of the CCI
- DeMarker
- Display DeMarker : select here use the indicator
- Period : period of the DeMarker
- AC
- Display AC : select here use the indicator
- AO
- Display AO : select here use the indicator
- Force Index
- Display FI : select here use the indicator
- Period : period of the Force Index
- Method : method of the Force Index
- ApplyTo : volumes of the Force Index
- Bulls
- Display Bulls : select here use the indicator
- Period : period of the Bulls
- Bears
- Display Bears : select here use the indicator
- Period : period of the Bears
- ADX
- Display ADX : select here use the indicator
- Period : period of the ADX