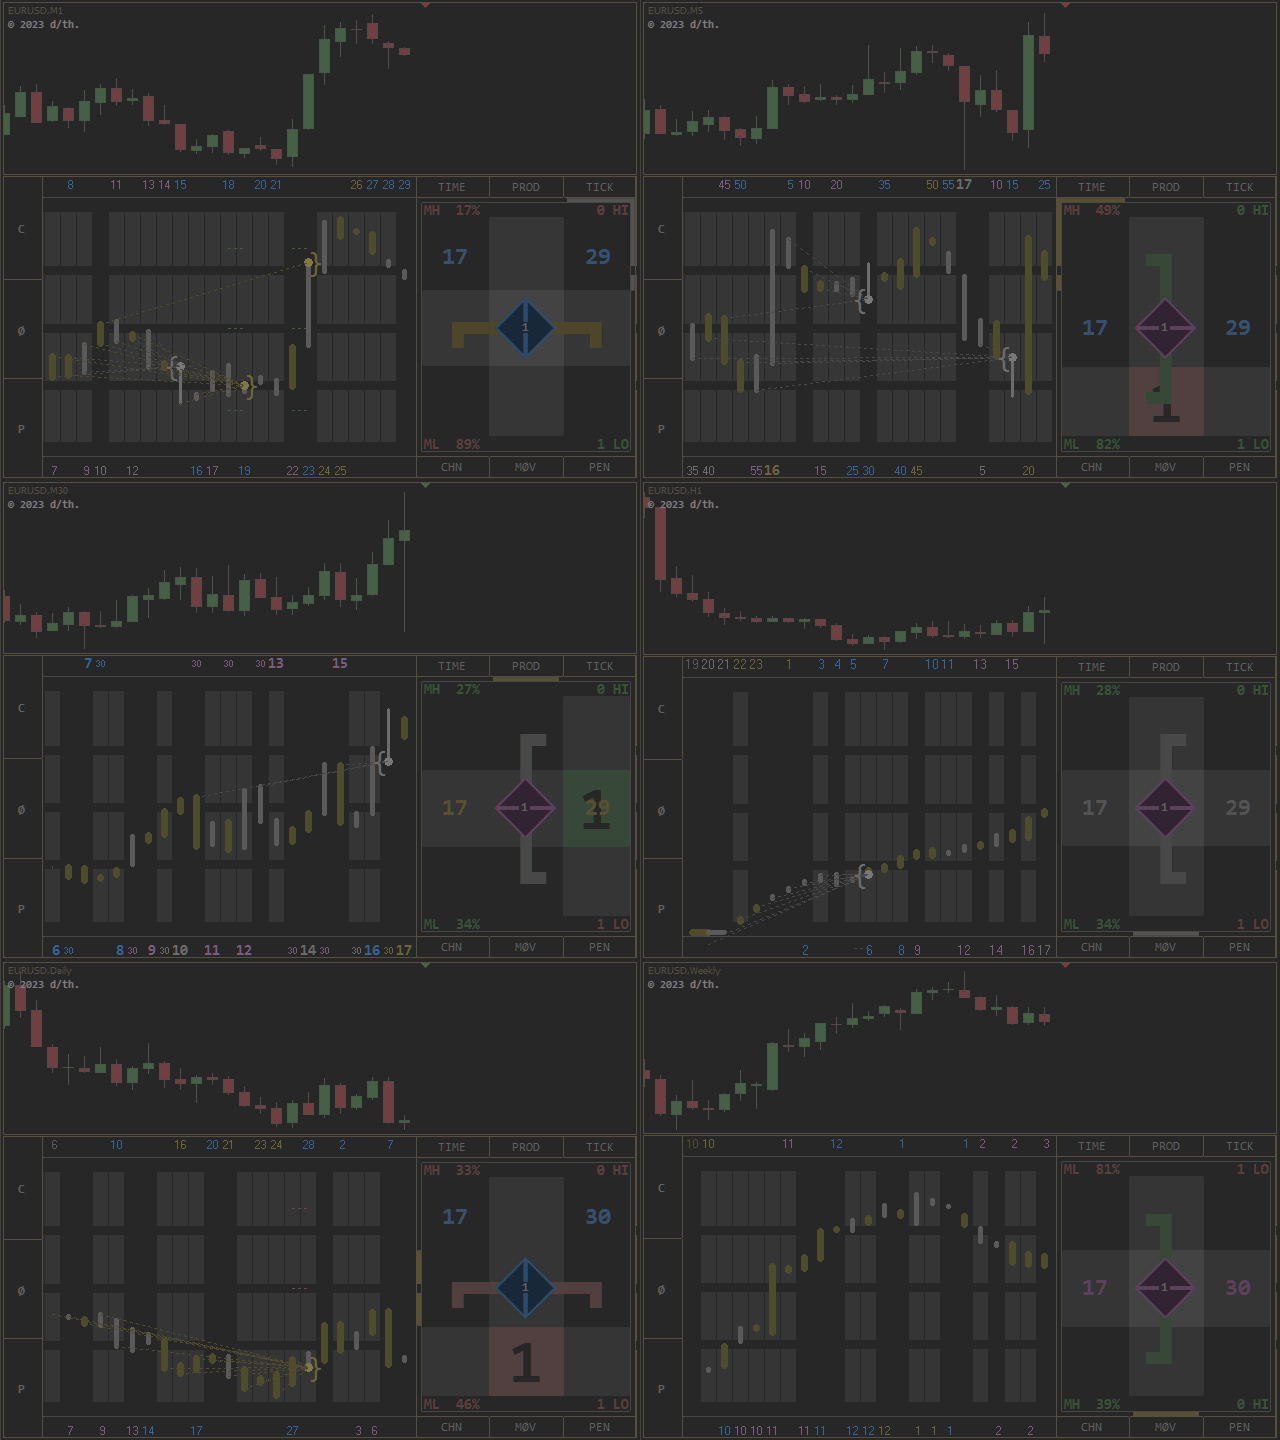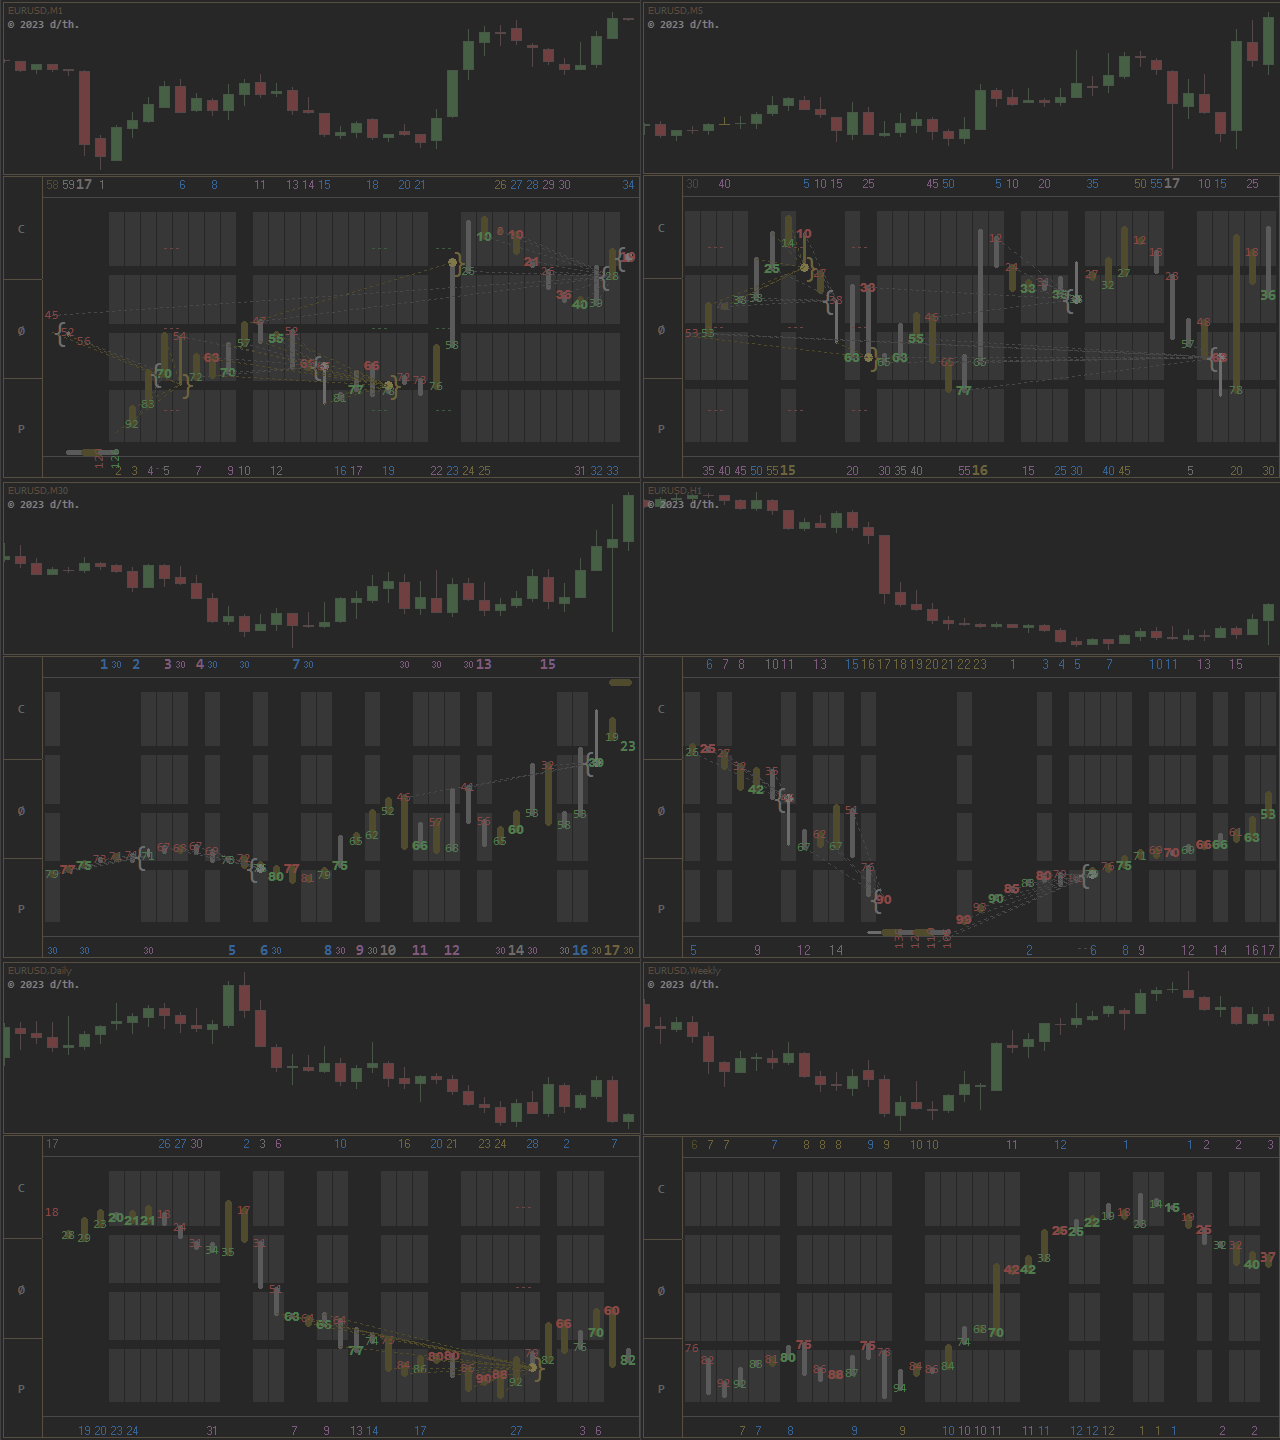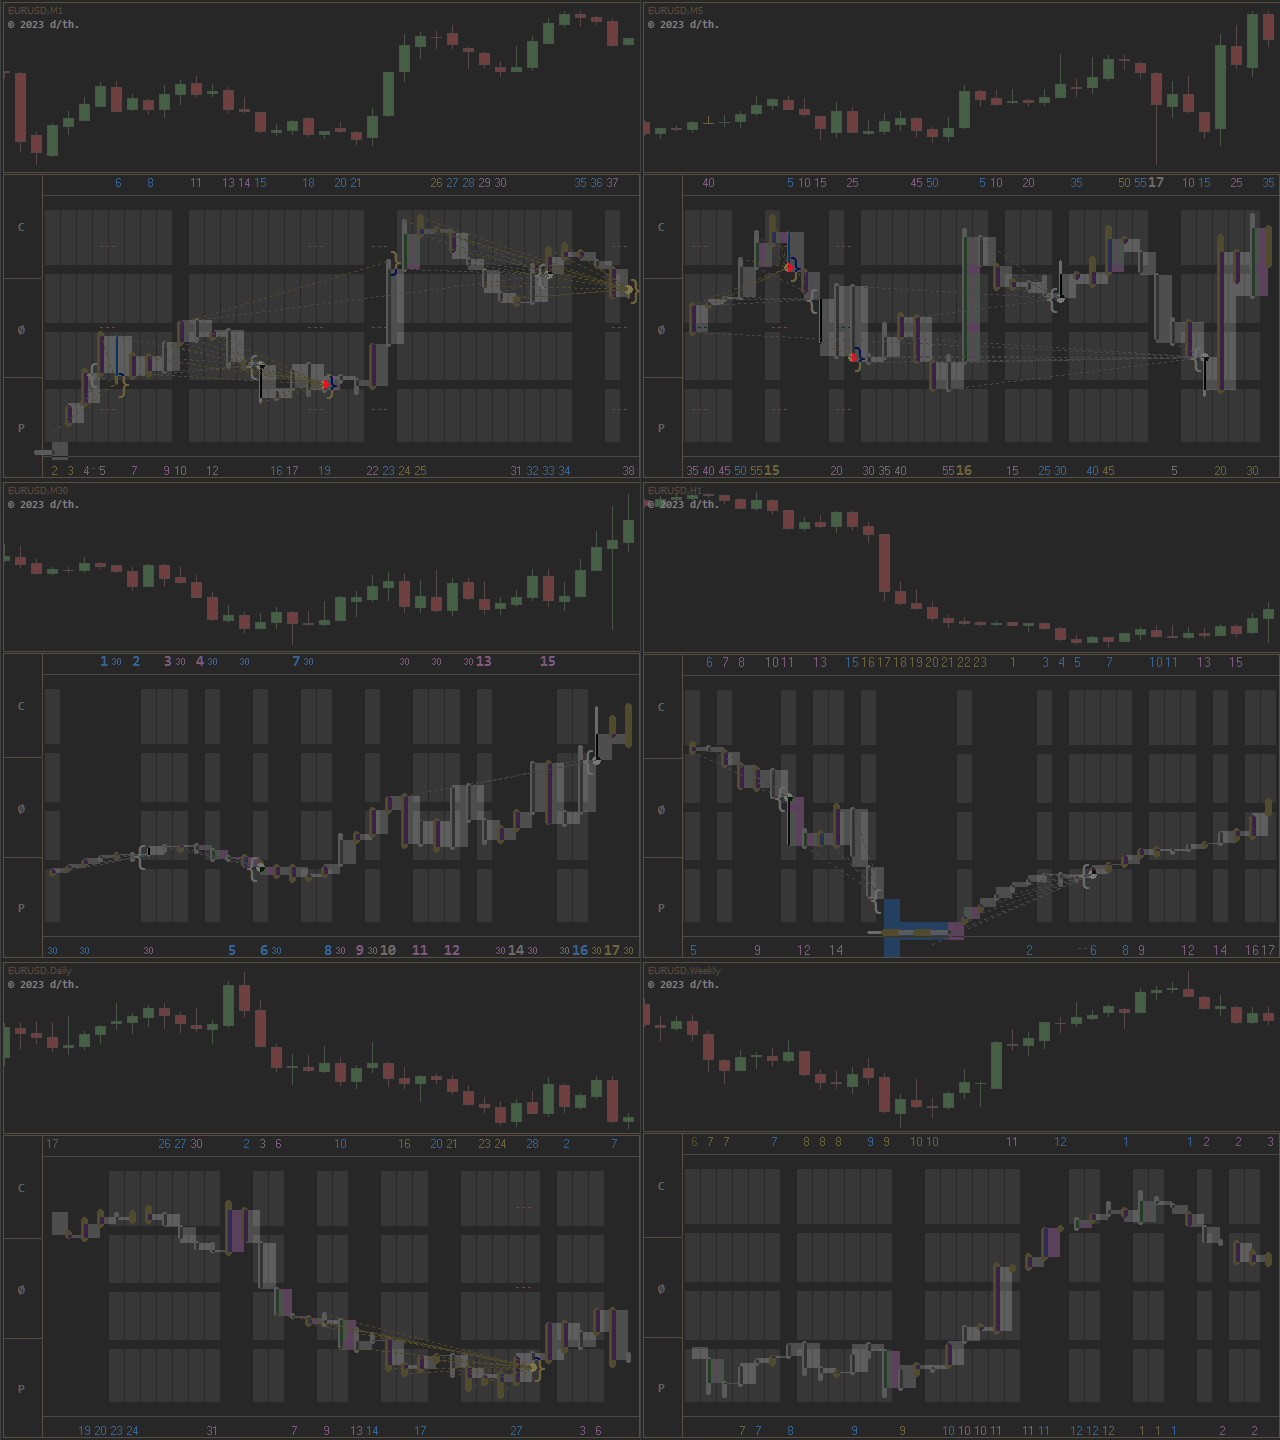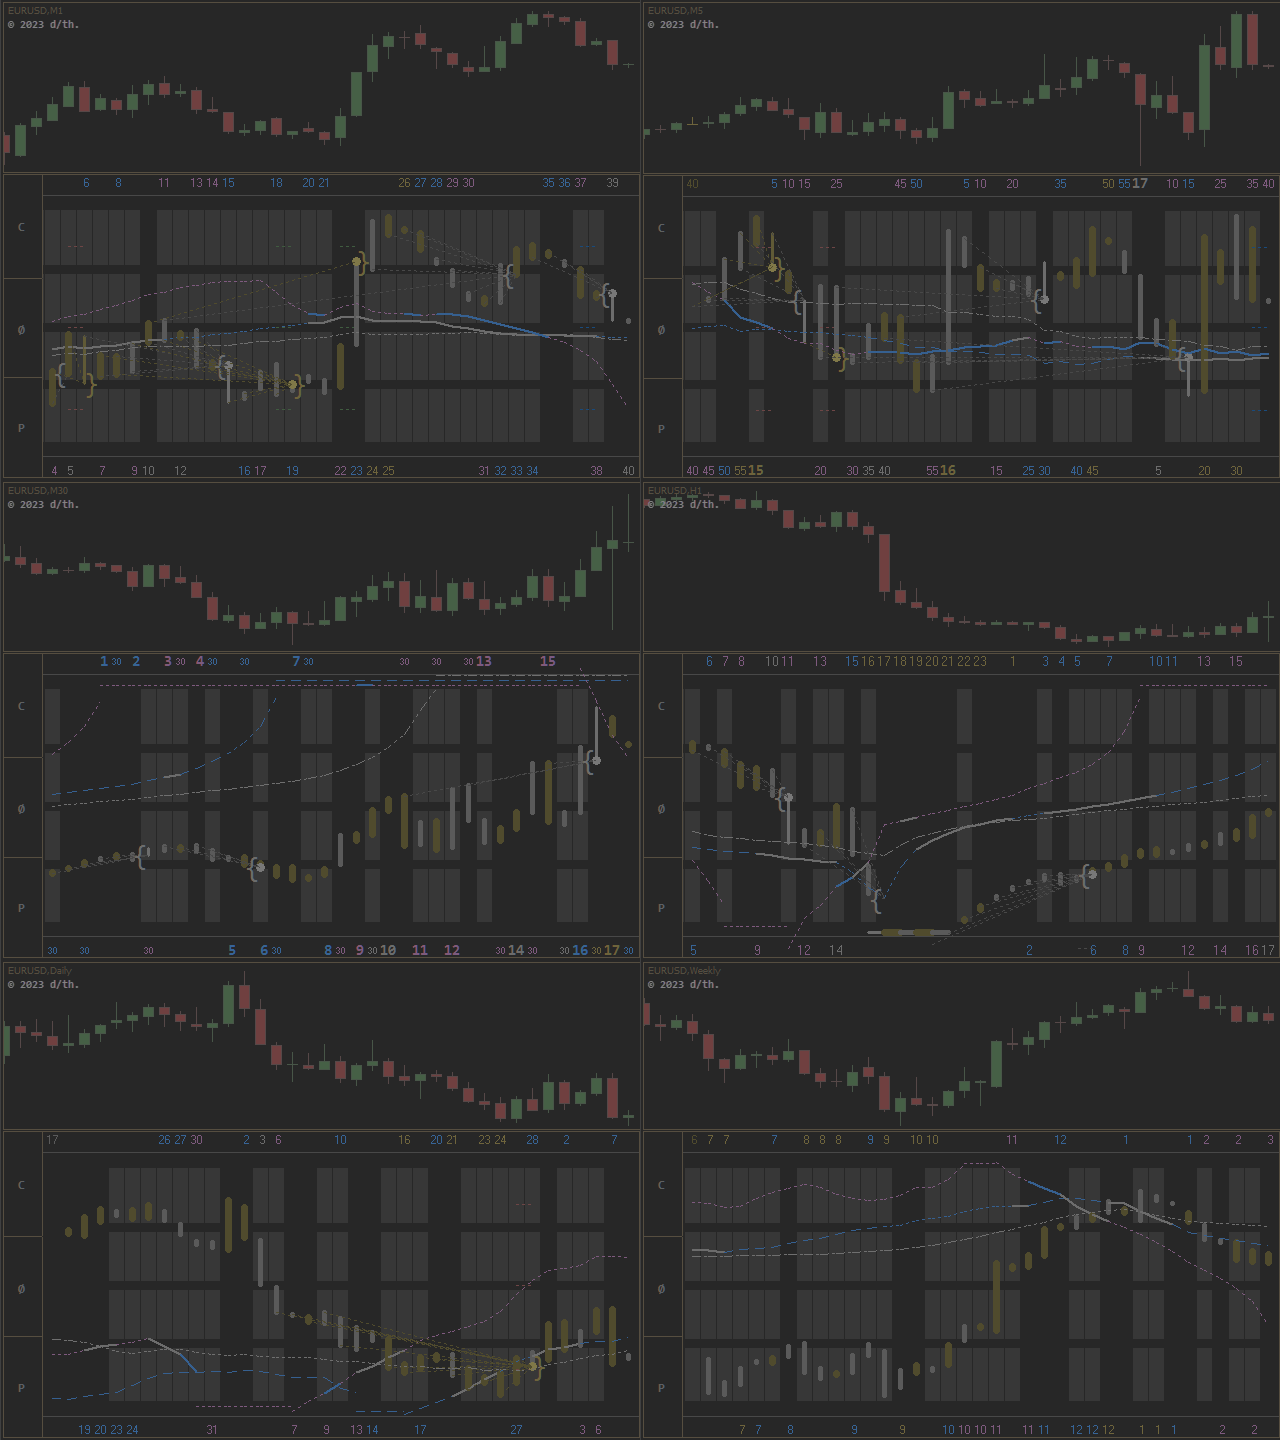
Concept
Market arranges in Time upcoming Phases according to the present Results of its Interest.
Directing Modulations are an Interaction of immanent Periods, which show in Reference
- to Time cyclic Activity and
- to Price leveling Activity.
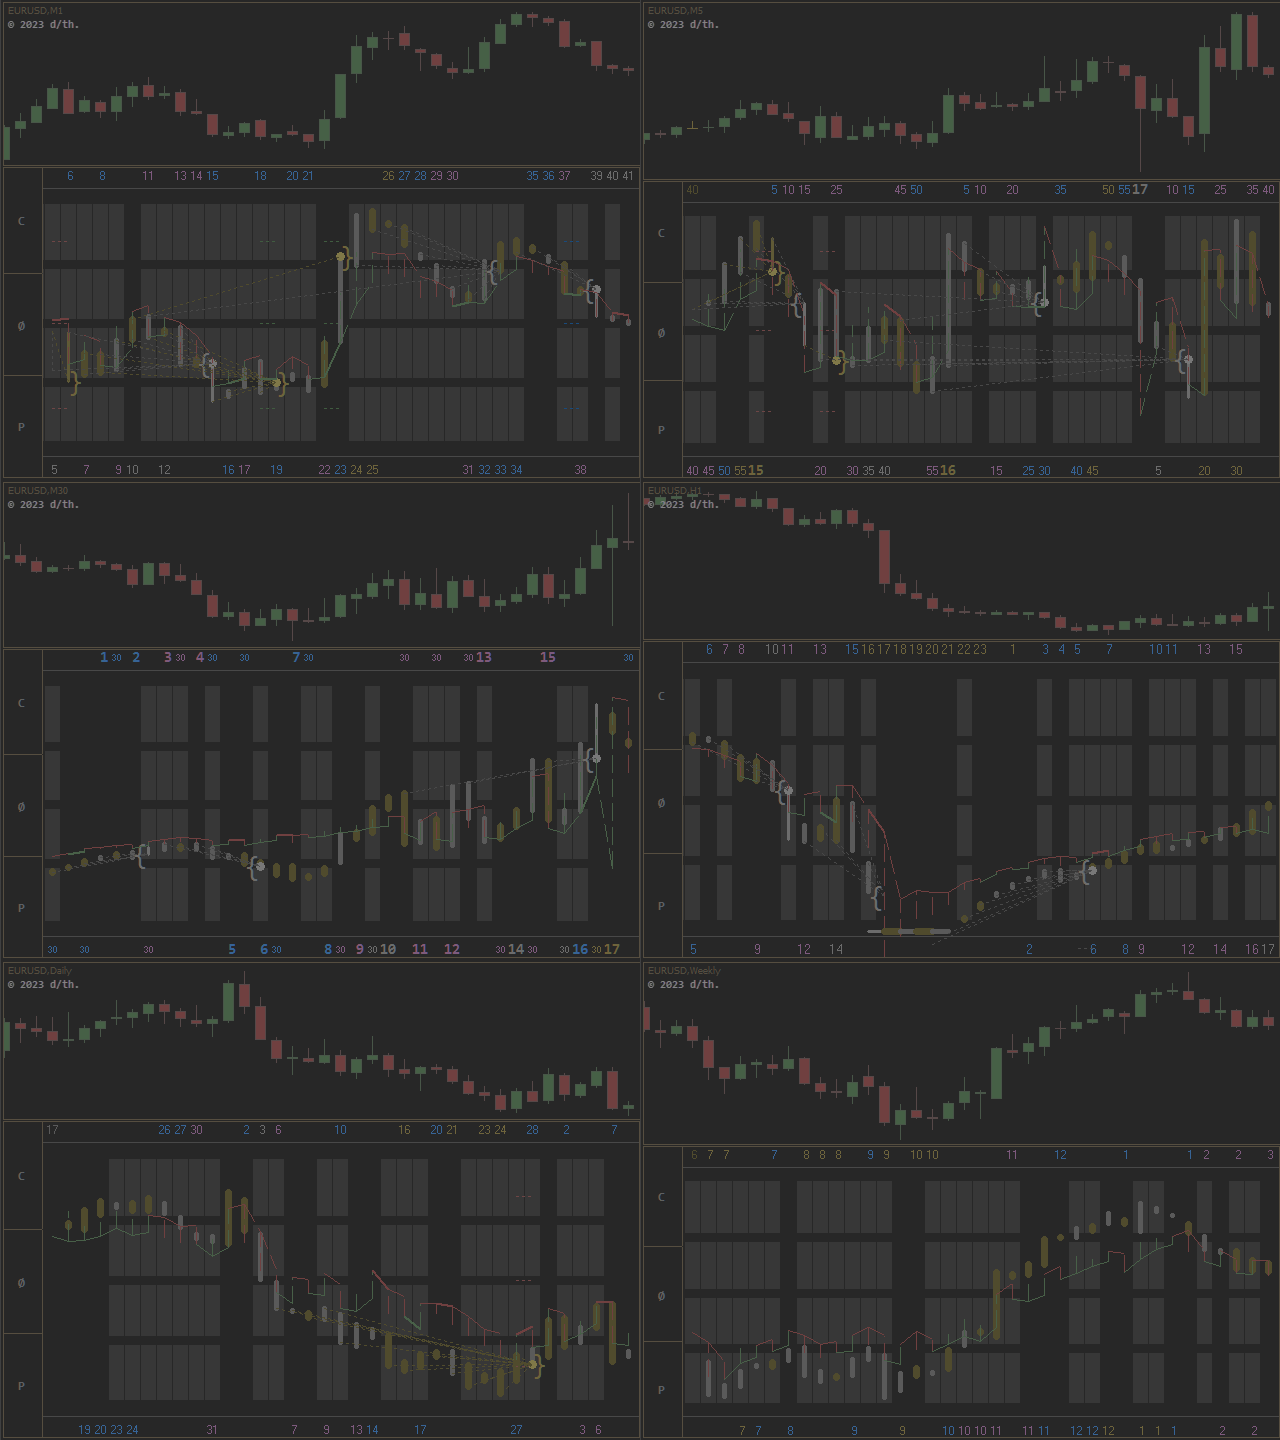
SensorMap is a reflecting Volume Mask of this Concept of Time and Price and
- apportioning developed Price Movements in an equalized 100 % - Range: how far moved ?
- indicating their Status by marking special Events: when which Action ?
- setting the Situation in a functional Relation to the presented Support/ Resistance - Motive: miss/ hit/ pass ?
equalize and reflect
Choose of relative
- Price Ranges and Moves
- Triple Moving Average
and mirror them instantaneously against their Channelcenter by Button on the Volume Band .
Content
Price Time Channel
Multidimensional, equalized/ flattened and mirrorable Timingband as Matrix for Time, Price, Tick and Averages in definable Appearance Option.
Period Event Notation
Price is noted (in Relation to W1 )
- as Bars, Clips [] and Streams (with Scales by ZeroLink),
- as Value (directional and white : Null/ Support, orange : Full/ Resistance),
- as Period Moves ( Color set by the reached Level in Channel),
- as High- and Low-Range Trends (related to MN , Color directional ).
Moving Averages
The Price Averages work as ranging Levels, each in its flattened Channel. They reflect the Movement as periodic Pricelines and cooperate .
Special Events are displayed :
- PointZero as situational Scale ( 15 / 50 / 85 %, blue: cyclic , green/ red: leveling )
- Close on limiting numeric Values (Fraction Hits bold ),
- Tick Deviation to prior Period > +/ - 15 % (Background bright )
- interdimensional Crosses ( Color Overtaking ) and periodic Triggers ( Line dotted ) of Moving Averages
- Objects beyond their respective Channelband are lined up at Chartborder until Reentry (= Time is ticking for this Component)
Layers
- framing periodic Timedisplay ( Side of Open/ if Zero at both Sides , Color: Channel Position )
- simplified Servertime Clock (Circulation = Period / 8) with relative Positions of M ove- H igh and M ove- L ow on actual Period Range
- the conditional BullBear Compass indicates situational Phases with 3 Symbols and 4 Aggregate States
- on the Productivity-Cube
Additional Benefits
- individual Appearance Preferences
- a detailed Definition of Objects and Functions by the Descriptive Mode (Tool Tips)
- adjustable Window Size, seamless functional Complement for its origin opposite Pricechart
Contemplate its Concentrate
The Signal Density is related to Markets actual Phase, chosen Timeframe/ Security and Components.
SensorMap generates as resulting Composition a defined Setting of Support and Resistance:
No Matter which Hemisphere: [ Open = Support | Resistance = Close ]
Both look like the Other.
The MindMask resolves the active Status.
A Picture is worth a thousand Words .
I ndicative : Colorized : Universal
Please find all necessary Informations to this Product in its Compendium.
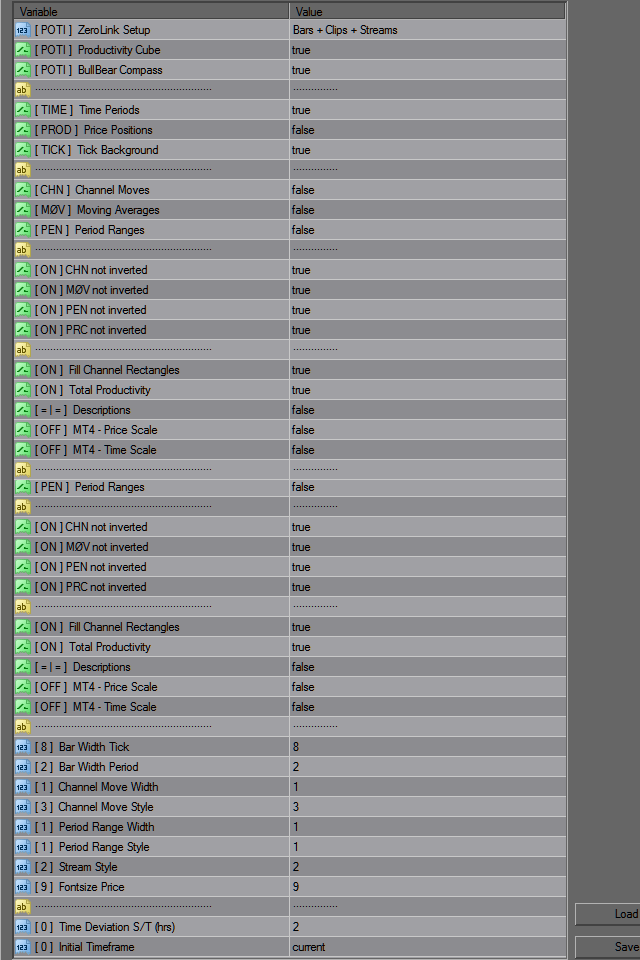
Below as Orientation the Extract of the individual Indicator-Adjustments.
Indicator SensorMap
Think global - Act local
Multidimensional, equalized and mirrorable VolumeBand
- as Matrix for Time, Price, Tick
- and Channel (Ranges/ Moves/ Averages)
- Window-Height = 135%
- Border-Clock-Frame = 115%
- Tick-Barsize = 100%
- colored ZeroPoint Scale = 15% / 50% / 85%
- black Bar-Divider = 25% / 50% / 75%
Buttons to the Left: Mirror-Function of C hannel/ A verage/ P en.
Edging Values are lined up at Chartborder.
Ideally in Completion with the PointZero PriceGraph is the VolumeBand a Composition of
Time Band = Equalizer
- 1 D Time
- periodic Sentence
and
- equalized Product = Timeline
Volume Clock = Oscillator
- 3 D Productivity Sensor + 12 D BullBear Compass
- Productivity = Potential
- -2 / -1 / 0 / +1 / +2
= Sensor = Sequence
- BullBear = Phase
- Rotor/Stator
- Trend/Trace
- Gator/Zero
= Compass = Sentence
[VALUE] =
- Boolean : Button Position on Chart
- Variable : default Value
The default View of the Chart consists of following Components and is read like follows :
Time Band
Moves ( escalative Trace/Trend ), by default depicted via ZeroLink -Module:
- Colors :
- Close = orange
- Open = brightgray
- as Pens (Bars)
- by Close and Open
- 2x2 overlaying Lineweights
- as Clips
- Perspective of Activa
- works as Pointer
- as Streams
- interactive OC -Work
- presents active Phase
- actual and last active Directive
- as big Dot
ZeroLink : Appearance of PointZero as periodic Scale (dotted)
- blue: active Time/ Cycle
- directional: active Price/ Level
Volume Clock
- Frame = Period Clock (Period / 8 )
- Background = Productivity Potentiometer 3 D
- Onlay Bull Bear Compass 12 D
- Onlay Clock
- Position on active operative Mode-Side
- Coloring according Price Position in Channel
- valid also for TimeBand-Frame-Periods
Shell % Shell % Tone <0 - 15
85 - 100>
orange
15 - 30
70 - 85
blue
30 - 45
55 - 70
violet
45 - 50
50 - 55
gray
Role 07: five-dimensional translating Volume-Channel
(Potential-Shells of Unit 1 = Being develops from Within ( 2 D-Center = 50% = 3 D-Center = 0% ))
Fundament
Body of Chart
The visual Conjunction of both Mask-Complements uses extra Room for additional
Buttons of the Price-Chart, to have direct Access to its three Core-Options.
ZeroLink Setup [POTI]:
Toggle the Composition of the default Chart-Layout:
- in Options :
- choose of limitless Adjustability
- on Chart :
- toggle separate Components
- by Click on the Poti-Background
- first Click minus Clips
- second Click minus Streams
- third Click minus Pens
- fourth Click all back
Productivity Cube [POTI]:
Productivity Display -1 / 0 / +1
VPP = Volume per Period :
- 3 vertical Bars
- absolute (= Frequency )
- Impulse / Period
- Sensitivity 15%
TPP = Ticks per Pip :
- 3 horizontal Bars
- relative (= Alteration )
- Impulse / Pip
- Sensitivity 33%
PPT = Pips per Tick :
- 9 resulting Positions
- total (= Oscillation )
- Pip / Impulse
- Sensitivity 2 x 25 = 50%
Role 08: three-dimensional ionic Productivity-Cube
VPP [-15%] VPP [= 0] VPP [+15%]
TPP [+33%] = 0 + 1 + 2 PPT [+50%] TPP [= 0] - 1 = 0 + 1 PPT [+25%] TPP [-33%] - 2 - 1 = 0 PPT [= 0]
PPT [-50%] PPT [-25%] PPT [= 0]
( ionic = Sensor of current electronic Potential)
BullBear Compass [POTI]:
Sensor of current sequential Phase
Arms : Color navigational/ positional
- Zero = gray
- Gator = orange
- else directional
Gate = Tap = Zero/ Gator
- Prop horizontal = Level Phase
- glides
- Prop vertical = Cycle Phase
- sways
Bull = Gap to North/ Lap to South
- Arms up = Rotor/ Level Trend
- hurls
- Arms right = Stator/ Cycle Trace
- looks like C, but is O
Bear = Gap to South/ Lap to North
- Arms down = Rotor/ Level Trace
- runs
- Arms left = Stator/ Cycle Trend
- looks not like C, but is C
Head : Color phasic
- blue: Cycle - W1-Activity
- violet: Level - D1-Activity
- Arrow = ver: Cycling/ hor: Leveling
- Divisor = ver: Stator/ hor: Rotor
- please recognize Frame and Inlet ( Cause + Effect )
Note :
The small central Number marks the Time-Deviation Server/ Terminal.
- No Deviation = · = dot if not
- Deviation < 9 sec = Seconds
- Deviation > 9 sec = ×
This Difference can be caused by either Side, because it measures
- current Server-Time against current System-Time.
Consequently it is also an Indicator, how precise the System-Time is adjusted.
Modern OS come with the Functionality of Time-Setting by atomic Clock-Data.
Please refresh sporadic the System and/or in Case of questionable Results.
Ensuring that delivers precise Notation about Deviations/ Differences/ Offsets.
Layers
The Averages work each in its respective Channelprojective Reflection = reflective Projection
The Card Deck :
Time Periods [TIME]
Toggle the framing Time - Display
- ( colored by Channel Position )
- Button-Click on the top Time-Row
- changes operative Mode from Open to Close
- recognizable at Color of Poti-Frame
- and Color Switch of Channel-Ranges
- Hit Rate around 100% when Resizing Window.
- Reminds , which of both Components
- unalterable is the directive One.
- Button-Click on the bottom Time-Row
- toggles Moving Averages
- first Click minus W1
- second Click minus MN
- third Click all back
Price Positions [PROD]
Toggle the relative Price - Values ( related to W1 -Channel)
An Inversion of the Price-Component is accessed by Click on the Propeller Head.
Tick Bars [TICK]
Toggle Background Histogram (bright-gray)
- notes VPP-Deviation < or > 15 % to prior Period.
= Phase -
- Acceleration [+]
- Deceleration [ - ]
- individual State (+/ - ) irrelevant
- due to resulting absolute PhaseChange
- Appearance of a bright Bar notes
- Center-Work, which is defined as decisional = intersecting .
Channel Moves [CHN]
The Rectangles operate in the W1 -Channel
Color :
- defined by Channel Position/ Break of Band
- violet = Step/ D1-Move/ Trace-Trend
- blue = Lift/ W1-Move/ Trend-Trend
- white = Null/ MN-Move/ Trace-Trace
- orange = Full/ H4-Move/ Trend-Trace
Adjust the Visual
- Fill Rectangles ( or not )
- set Linestyle/ -width
by Integer in the last Section.
Moving Averages [MOV]
that means : the Subwindow-Scalation is valid related to the Phase of the Component.
Their Behaviour is easily comprehensible via PointZero - Indicator.They cooperate and affect their passing Neighbor interdimensional,
- depicted as Color-Overtaking, if they pass near enough.
Their relative Movements reflect the actual leading Priceline/s .
They show in Cooperation with the framing Clock the Time.
Period Event Notation [PEN]
The Period-Trend is related to the MN-Channel and
- builds a directional HI-LO - Grid according to the
- actual RH/ MH/ ML/ RL - Development.
- D 1 -Price in Relation of the Monthly Channel results as
- exponential Translation of internal Period-Positions (of OHLC).
Pre-Adjustments of inverted Nature :
- Inversion/ MirrorView initially off
- toggle separately for every Component
Adjustments of general Nature :
- toggle the Visual of the Channel-Moves (filled/ lined Rectangles)
- toggle the Display of the Productivity-Potential (colored Position without Value)
- The Descriptive Mode is useful for Orientation or Confirmation ( of not finally settled Experience ).
- The MT4-Scales are a "fundamental Adjustment". In particular not resolvable for me. Mine is time-sensitive.
Integer/ Double
constant variable = variable constant
The Icing :
- preadjust Styles/ Widths/ Fontsize (Effect limited)
- Time-Deviation : Server-Terminal (in Hours)
- Initial Timeframe : self-explaining
logiclaboratory studio
© 2018-2023 /thiejden.
