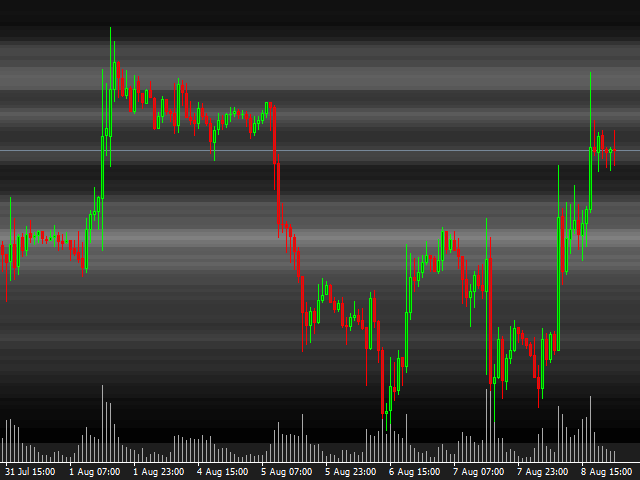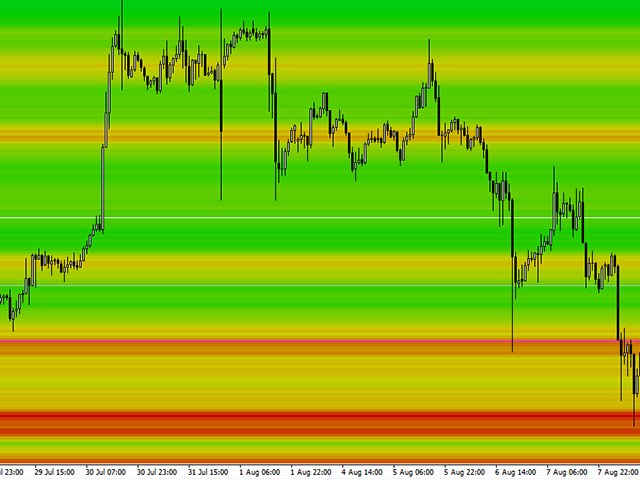
IceFX Heatmap is a special indicator that shows the places where the price has been staying and ranging over the past few days. These sites will be displayed in a "Heatmap style", with which you can clearly see the main formed bands. The main rates (where the price has "lingered/stayed" much) are indicated in bright colors (in case of black-and-white view) or red color (in case of color view).
Settings
- Days - the number of days the heat(map) is calculated for.
- Resolution - resolution rate. 10 = 1 pip. The smaller this number, the more accurate the drawing and the calculation. Therefore, more resources will be needed.
- Monochrome - black and white or color display.
- FullBackground - full or partial drawing.
- HSLS, HSLValue - HSL values for color display.