The GTAS BSI is an indicator designed to provide the trend direction and buy/sell signals, using combination of momentum indicators.
This indicator was created by Bernard Prats Desclaux, proprietary trader and ex-hedge fund manager, founder of E-Winvest.
Description
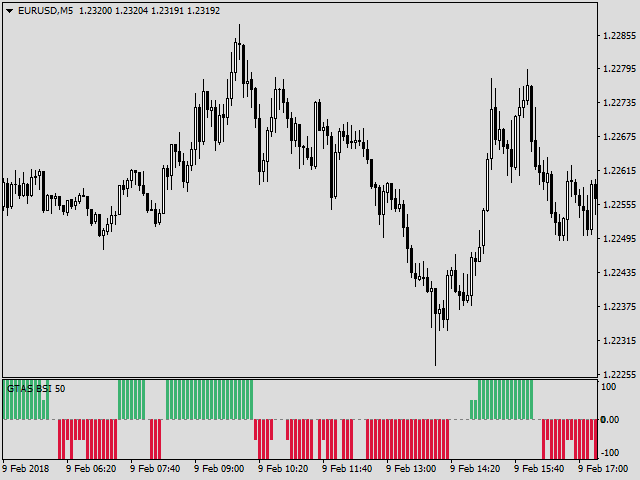
The BSI indicator is represented as a histogram under the price chart.
- +100 (green) value indicates a bullish trend.
- -100 (red) value indicates a bearish trend.
- When the BSI turns to +100 (green), it gives a potential buy signal.
- When it turns to -100 (red), it gives a potential sell signal.
- Intermediate values +50, 0 or -50 indicates no particular signal.
How to use
Open a trade
- Open a Long when the BSI turns to +100 (green), for instance, if the trend is bullish on the upper timeframe, or according to your strategy: this is the right timing.
- Open a Short when the BSI turns to -100 (red), for instance, if the trend is bearish on the upper timeframe, or according to your strategy: this is the right timing.
Do not trade against the BSI value
- Do not buy the market if the BSI value is not equal to +100.
- Do not sell the market if the BSI value is not equal to -100.
Hold and manage opened positions
- As long as the BSI value remains at +100, we can hold a Long trade.
- As long as the BSI value remains at -100, we can hold a Short trade.