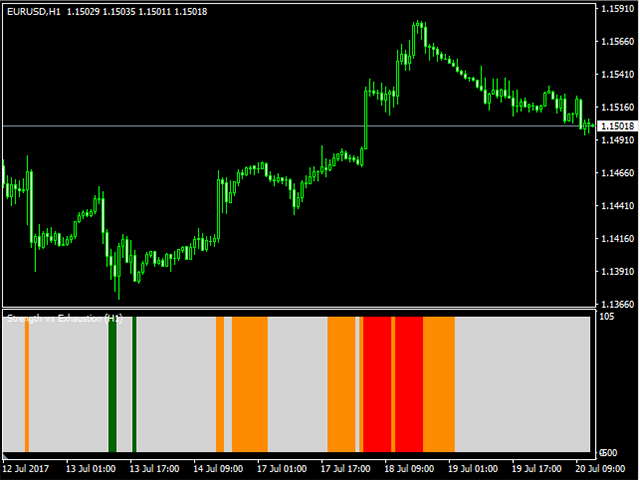
A visually-simplified version of the RSI. The Relative Strength Index (RSI) is a well known momentum oscillator that measures the speed and change of price movements, developed by J. Welles Wilder. Color-coded bars are used to quickly read the RSI value and history.
Features
- Find overbought and oversold situations at a glance.
- The indicator is non-repainting.
- The indicator can be easily used as part of an EA. (see below)
Basic Strategy
- Look for shorts when the indicator is overbought.
- Look for longs when the indicator is oversold.
Inputs
- Select RSI Period: Set the period of the RSI (21 is recommended)
- Last Bar Included: Include the bar being drawn in the RSI calculation
- LEVELS SETTINGS
- Level 1 Lower Limit (Overbought): The RSI value from which and above the market is considered the most overbought.
- Level 2 Lower Limit: The RSI value from which and above Level 2 starts.
- Level 3 Lower Limit: The RSI value from which and above Level 3 starts.
- Level 4 Lower Limit (Neutral): The RSI value from which and above Level 4 starts.
- Level 5 Lower Limit: The RSI value from which and above Level 5 starts.
- Level 6 Lower Limit: The RSI value below which the market is considered the most oversold.
- Level 7 Lower Limit = 0 (Oversold): Always 0, since the RSI ranges from 0 to 100.
- COLOR SETTINGS
- Level 1 Color (Overbought): The color of the indicator when the RSI has a value from the lower limit of level 1 and above.
- Level 2 Color : The color of the indicator when the RSI has a value from the lower limit of level 2 and above, till the lower limit of level 1.
- Level 3 Color : The color of the indicator when the RSI has a value from the lower limit of level 3 and above, till the lower limit of level 2.
- Level 4 Color (Neutral): The color of the indicator when the RSI has a value from the lower limit of level 4 and above, till the lower limit of level 3.
- Level 5 Color: The color of the indicator when the RSI has a value from the lower limit of level 5 and above, till the lower limit of level 4.
- Level 6 Color: The color of the indicator when the RSI has a value from the lower limit of level 6 and above, till the lower limit of level 5.
- Level 7 Color (Oversold): The color of the indicator when the RSI has a value below the lower limit of level 6.
For EA Developers
Use Buffer = 7 to load the RSI level to an EA. The return values are:
- Level 1 = 0
- Level 2 = 1
- Level 3 = 2
- Level 4 = 3
- Level 5 = 4
- Level 6 = 5
- Level 7 = 6