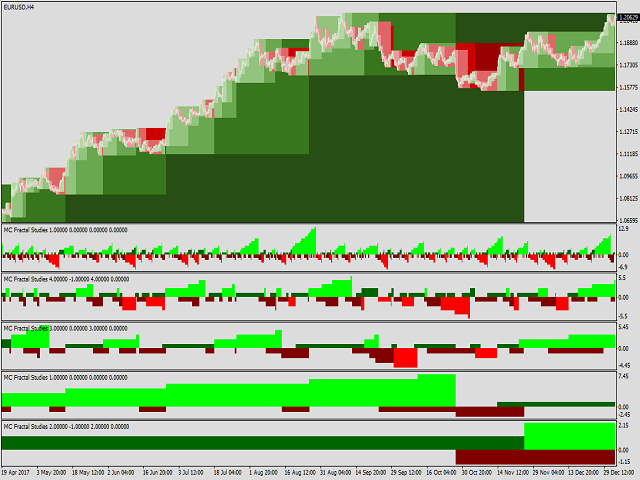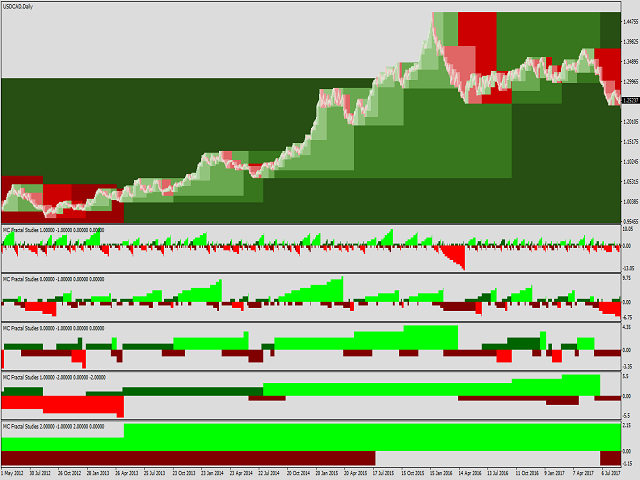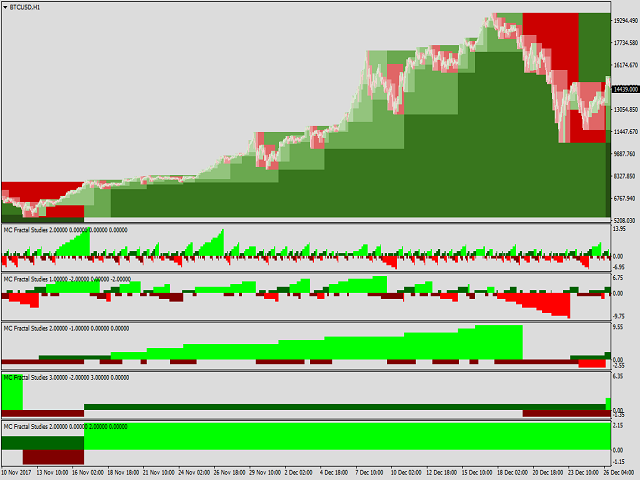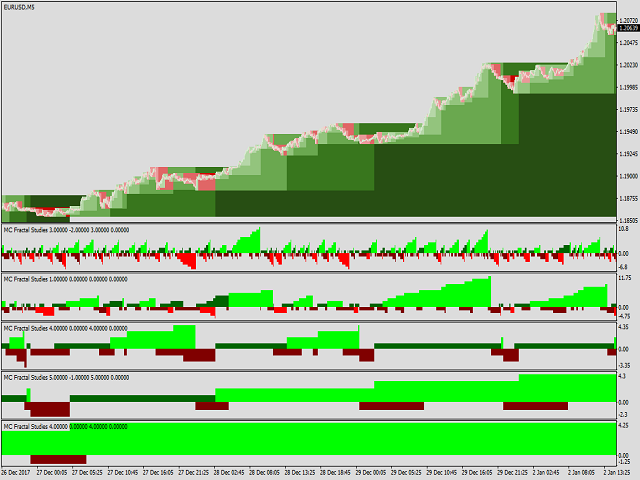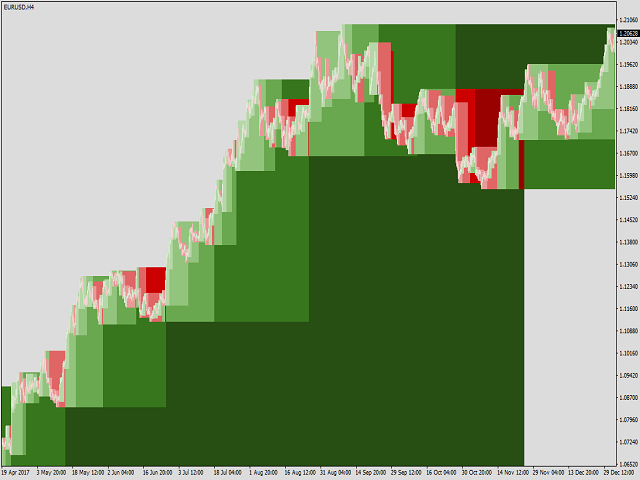
The indicator show the various supports and resistances on the chart, using different colours to differentiate them.
The lighter the colour, the smaller the wave.
The resulting effect is a nice coloured chart that gives a 3D (three dimensional) feeling.
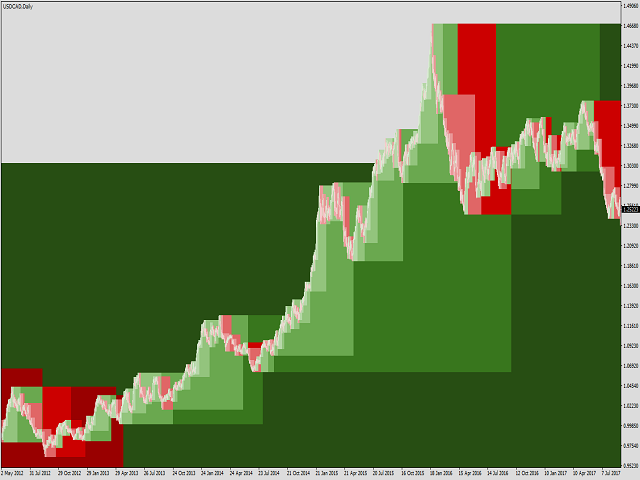
They work on every timeframe, every market.
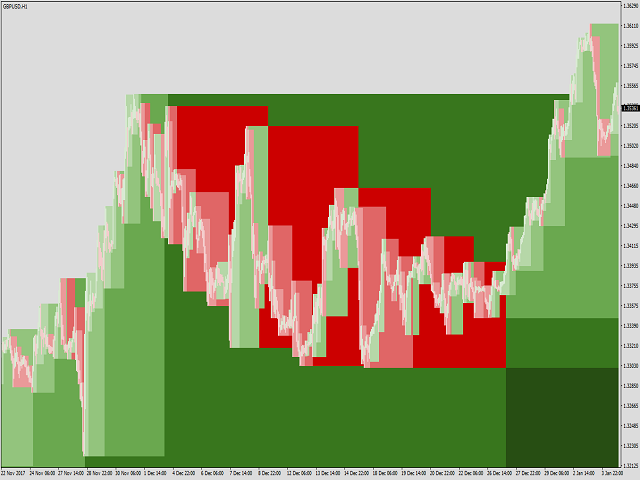
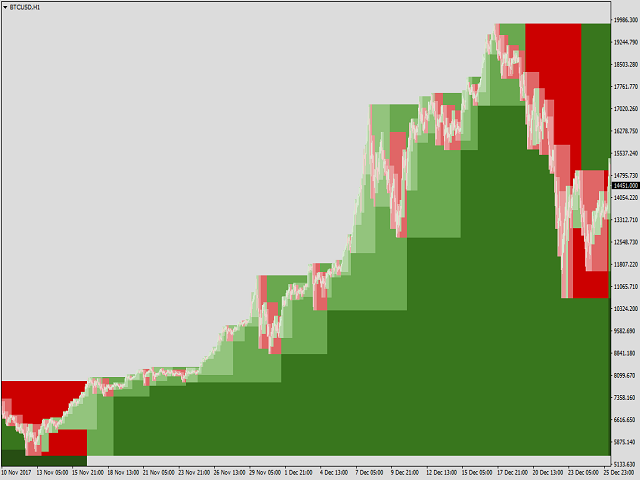
When the price is trending up , you will observe green colors below price.
As long as price stay above the green (supports), that particular wave-trend is UP .
When the price is trending down , you will observe red colors above price.
As long as price stay below the red (resistances), that particular wave-trend is DOWN .
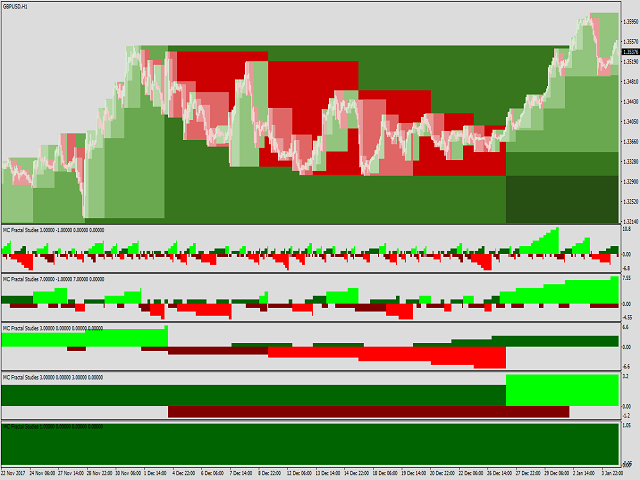
The best way to use this indicator is in conjunction with one of the other MC Fractal Studies ©.
You can find them in MQL5 Market under the name MC Fractal Studies Main Indicators.
Tip: Keep MAX 5000 bars in your chart for a smooth use of MC Fractal Studies ©.
How to set max bars in your chart in your MetaTrader:
Tools > Options > Charts > Max Bars in Chart : put 5000.
Then close and reopen your MetaTrader 4.