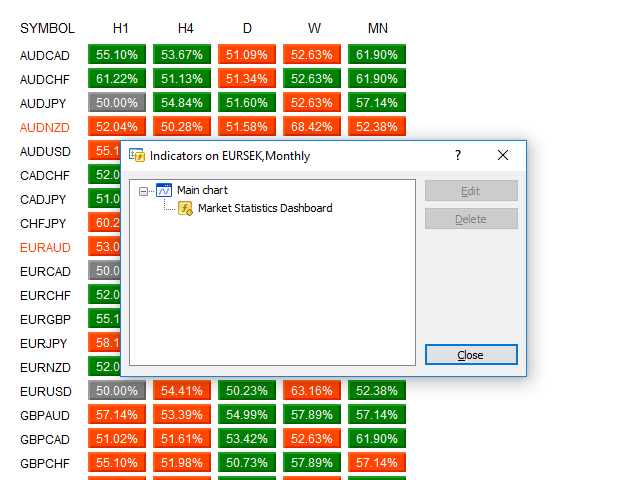
Market Statistic Dashboard is an interesting tool for statistic analysis.
This indicator scans the market and returns very accurate statistical analysis.
The analysis is based on historical data.
For example: it analyzes monthly chart and compares all the monthly charts in the past.
The statistical analysis is run also on other TFs: weekly and daily ones.
It is necessary to wait for the confluence of all timeframes to have a higher statistical certainty for the trading signal.
Note: refresh your history center to have more reliable statistical data.
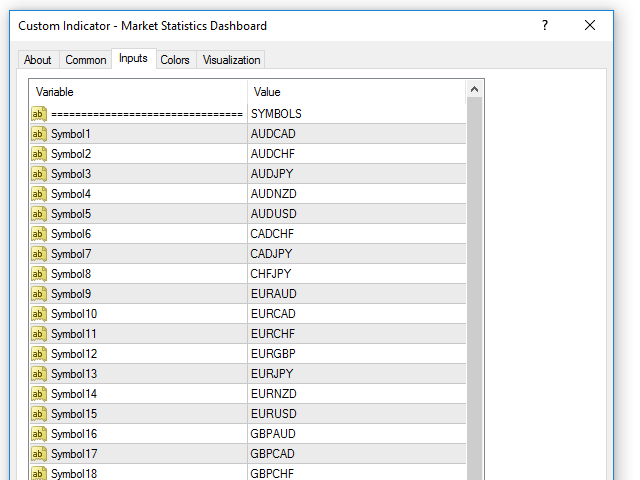
Inputs
- SYMBOLS (28 symbols)
- Suffix to hide (insert the Suffix to hide from symbols)
- TF SETTINGS
- Enable_H1
- Enable_H4
- Enable_D1
- Enable_W1
- Enable_MN
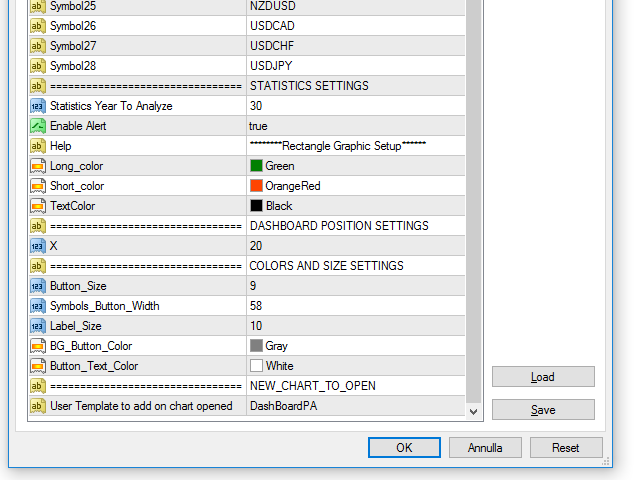
- STATISTICS SETTINGS
- Statistics Year To Analyze (How many years to analyze)
- Enable Alert (the dashboard gives an alert when all TFs are of the same color)
- RECTANGLE GRAPHIC SETUP
- Long_Color (Long results > 50%)
- Short_Color (Short results > 50%)
- TextColor (results = 50%, not valid)
- DASHBOARD POSITION SETTINGS
- X to change the position from High
- COLORS AND SIZE SETTINGS
- Button_Size
- Symbols_Button_Width
- Label_Size
- Button_Text_Color
- NEW_CHART_TO_OPEN
- Open_In_A_New_Chart (true/false)
- User Template to add on chart opened