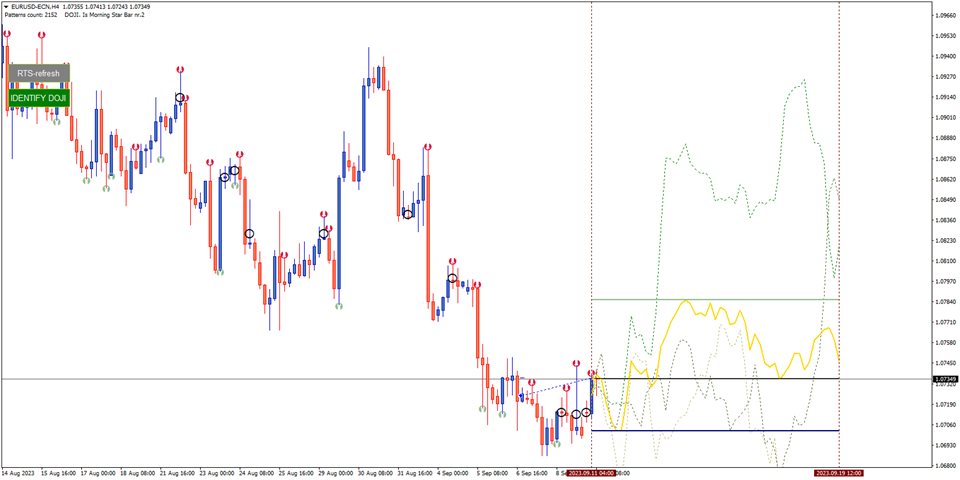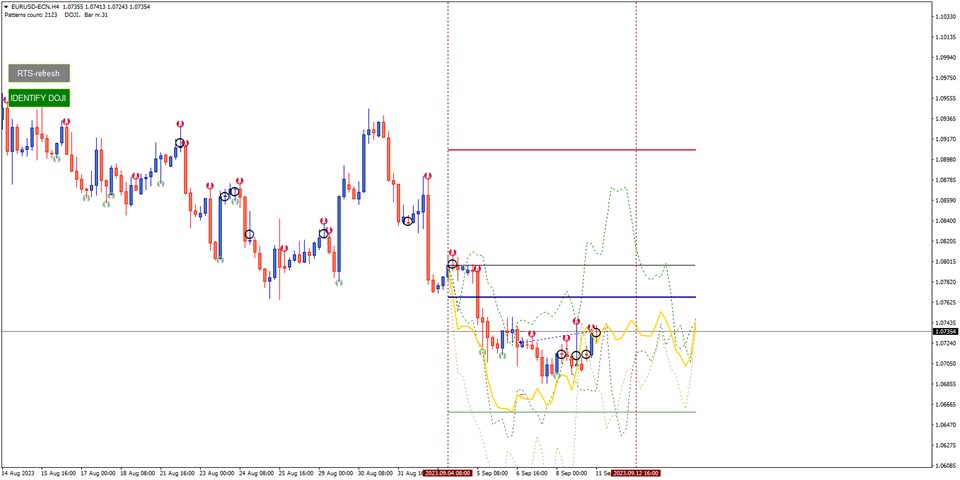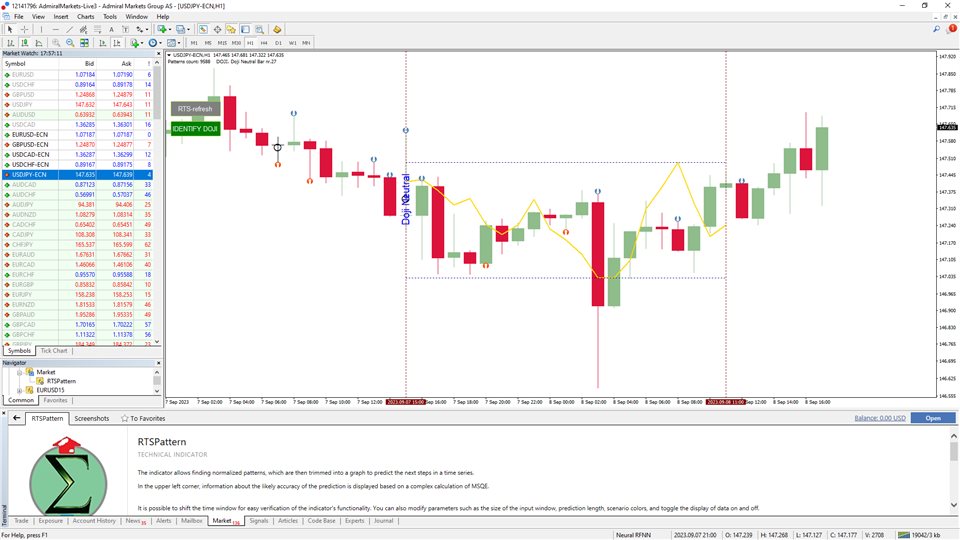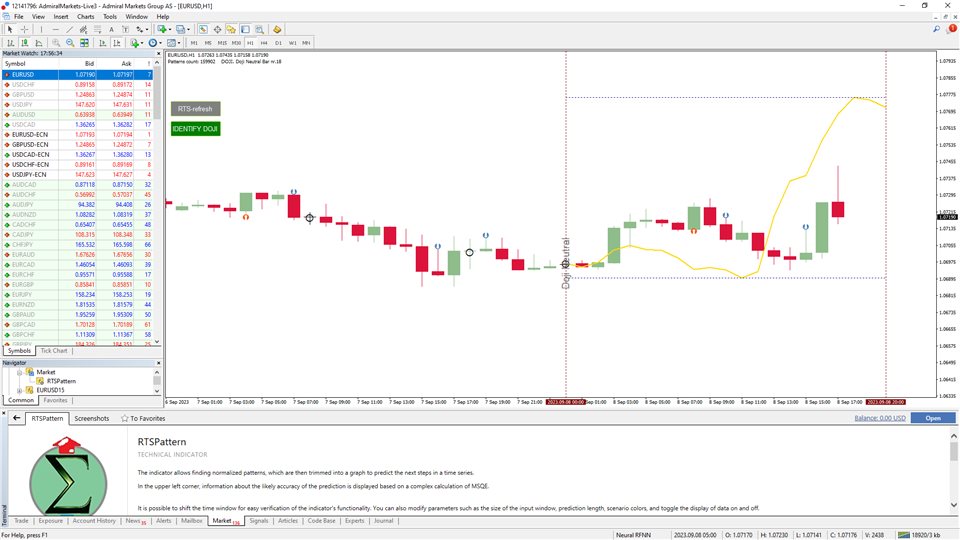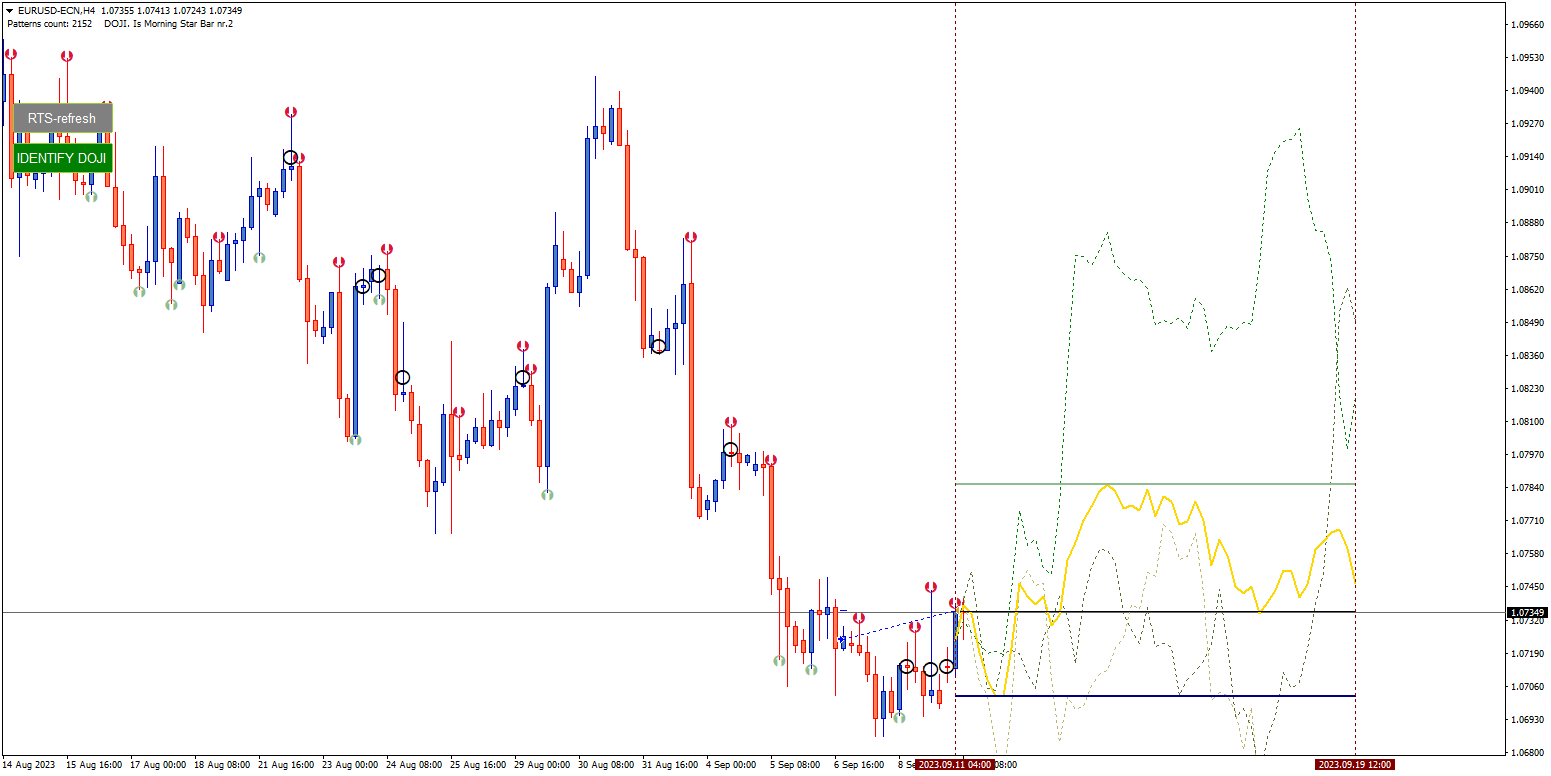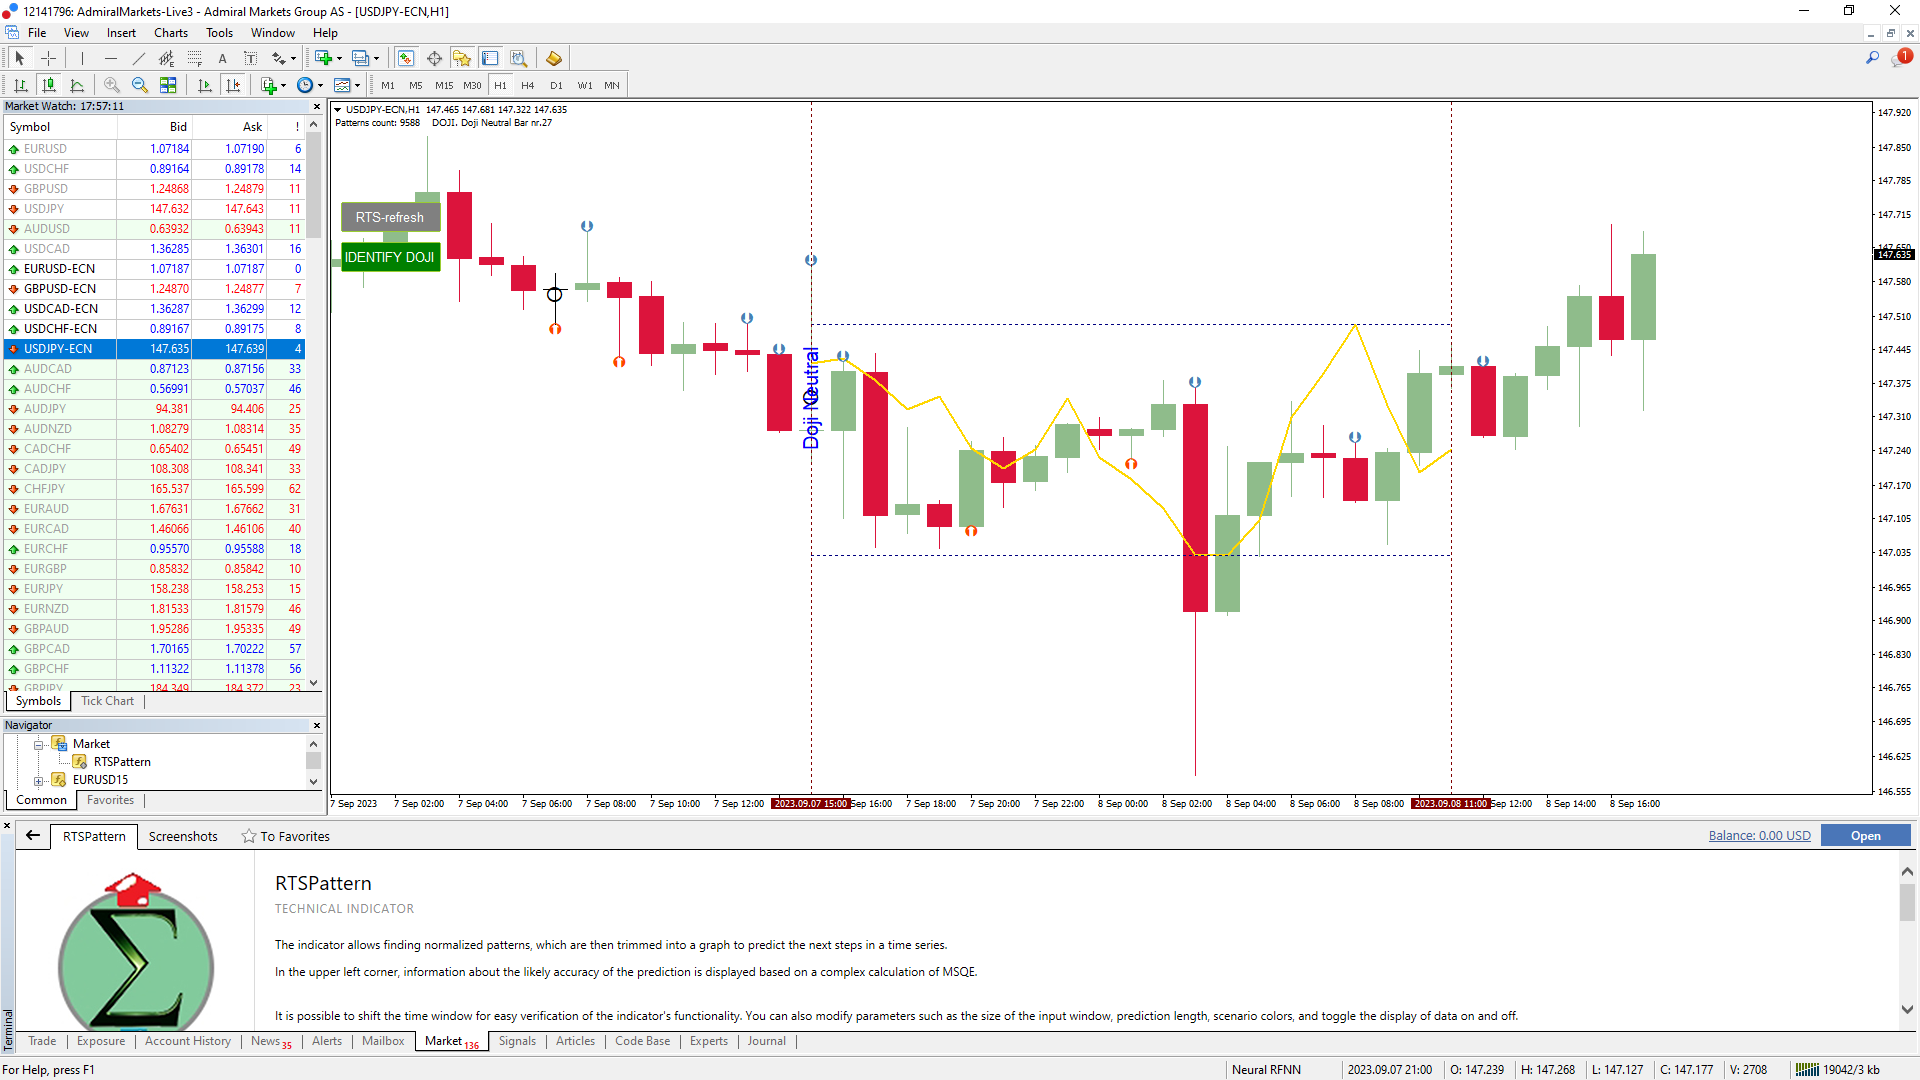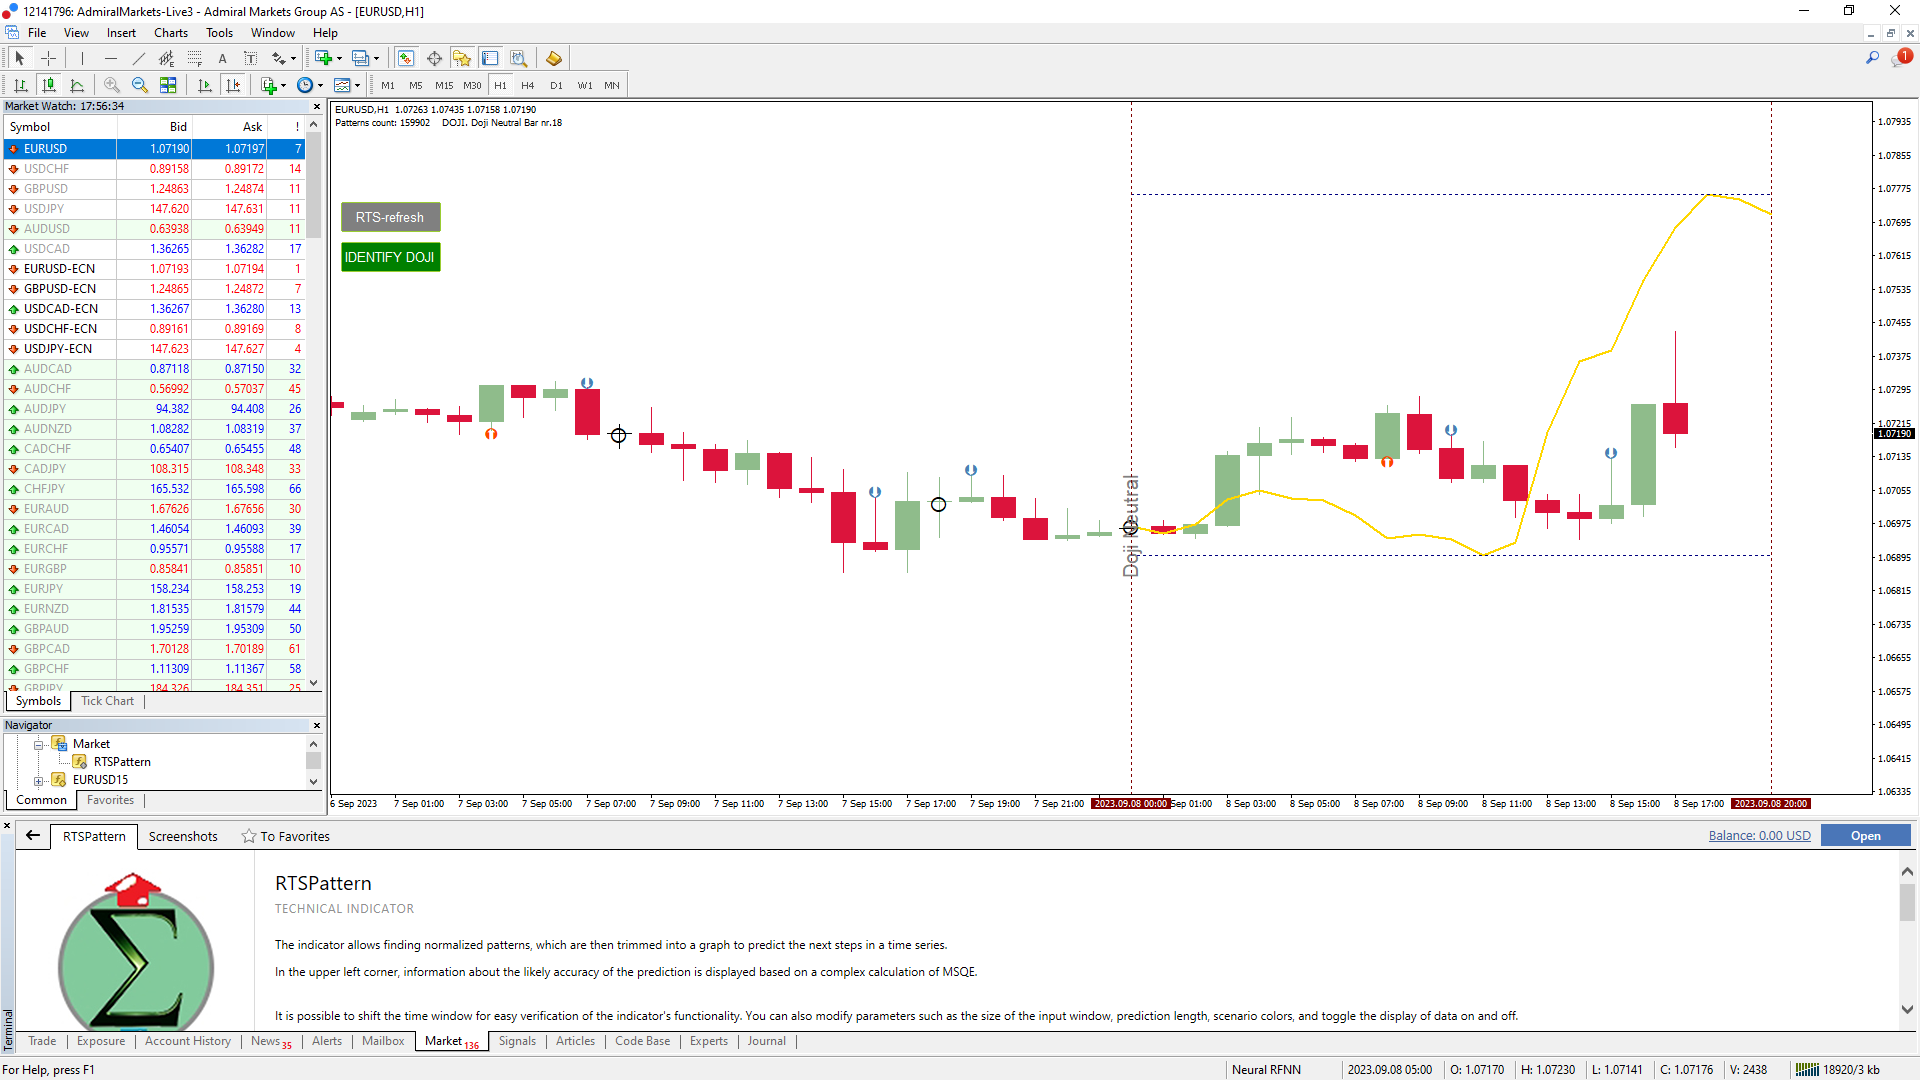
The indicator allows finding normalized patterns, which are then trimmed into a graph to predict the next steps in a time series.
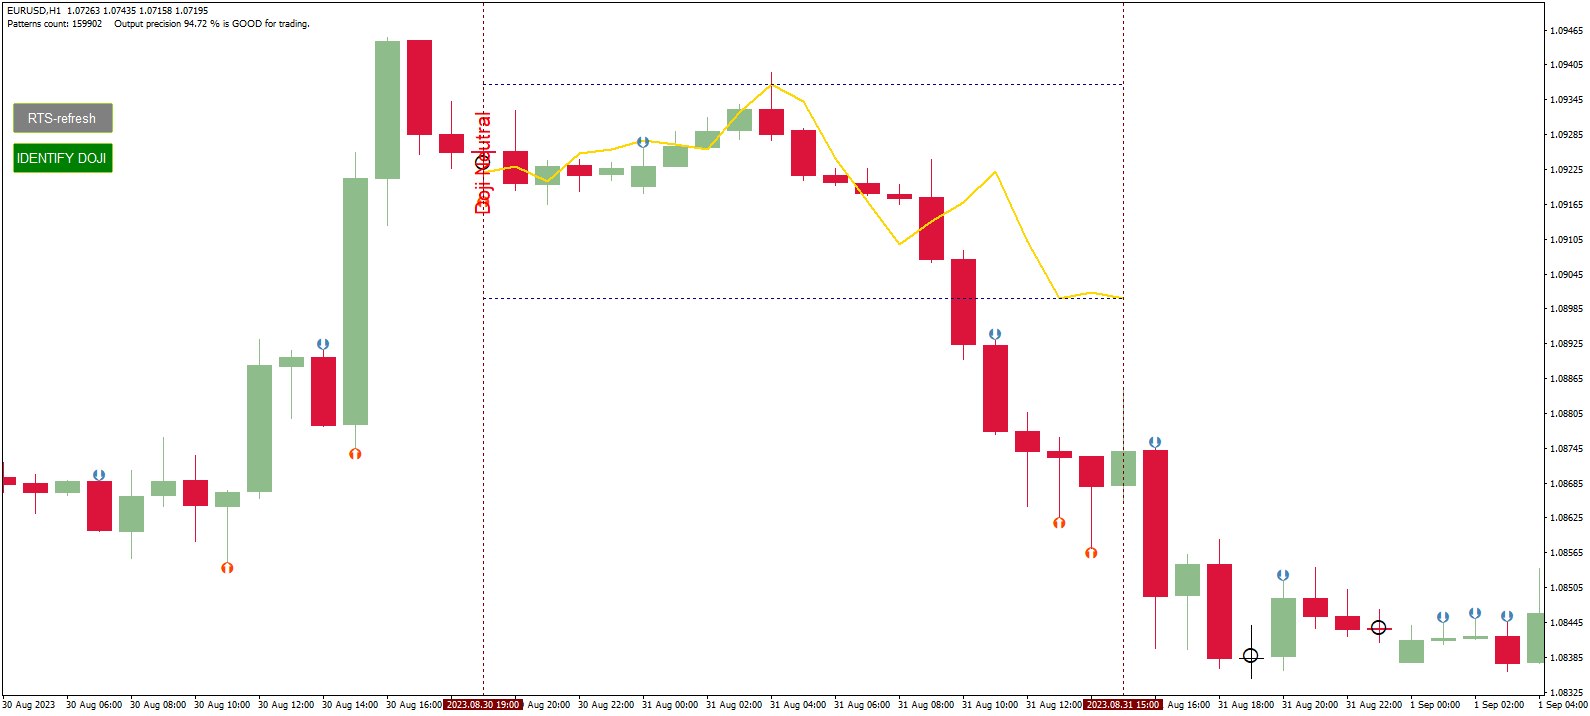
In the upper left corner, information about the likely accuracy of the prediction is displayed based on a complex calculation of MSQE.
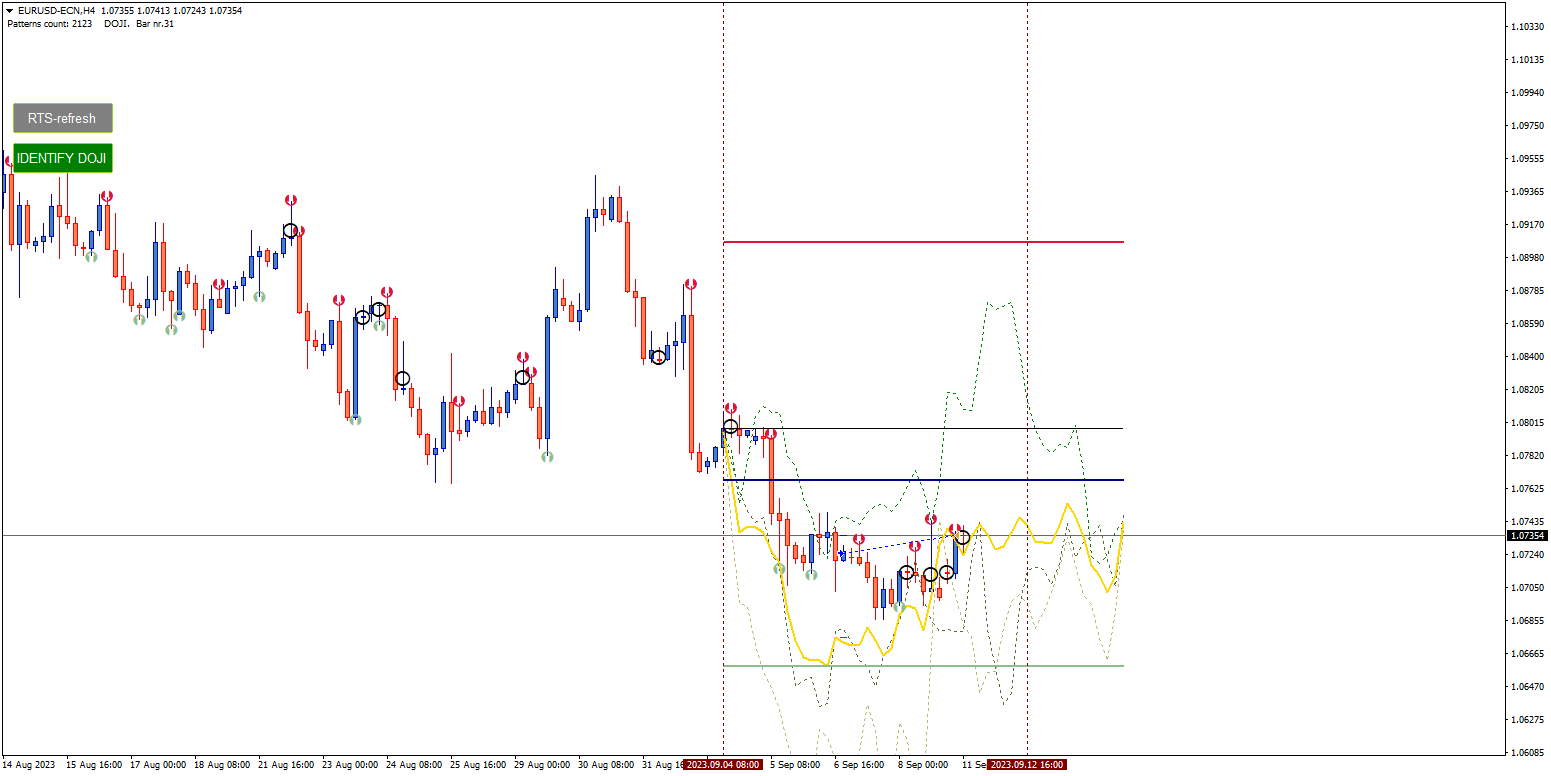
It is possible to shift the time window for easy verification of the indicator's functionality. You can also modify parameters such as the size of the input window, prediction length, scenario colors, and toggle the display of data on and off.
The indicator creates scenarios based on historical data, and the deeper the data you have loaded in the MetaTrader history, the more precise the output from the indicator becomes. Predictions are formed based on historical events that are identified using patterns.
https://www.mql5.com/en/charts/18194619/eurusd-d1-admiral-markets-group
https://www.mql5.com/en/charts/18194621/audcad-d1-admiral-markets-group
https://www.mql5.com/en/charts/18194623/audcad-d1-admiral-markets-group