Excellent dashboard for market analytics.
The panel helps to analyze the values of the RSI indicator and its signals.
With this panel you can:
- watch the current signal from RSI on all timeframes;
- watch the current signal from RSI by different symbols;
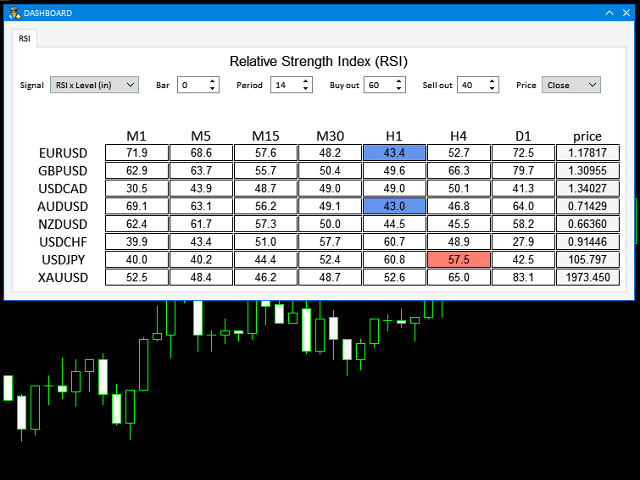
- watch the current RSI value;
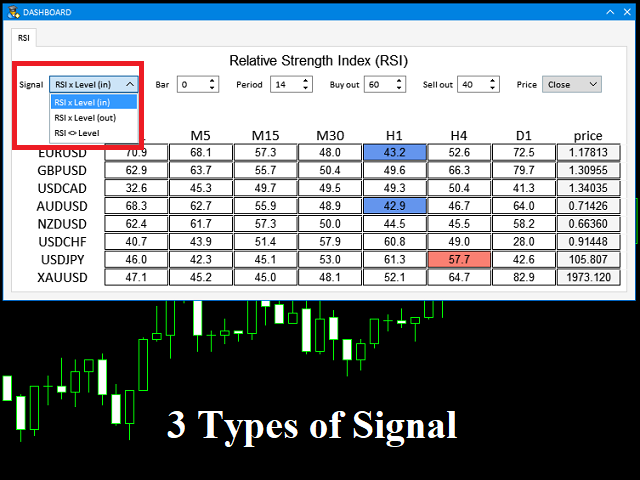
- several types of signals for analytics.
Values in a table cell:
- RIS value.
Signal type:
- RSI crosses level buy out/level sell out (outside);
- RSI crosses level buy out/level sell out (inside);
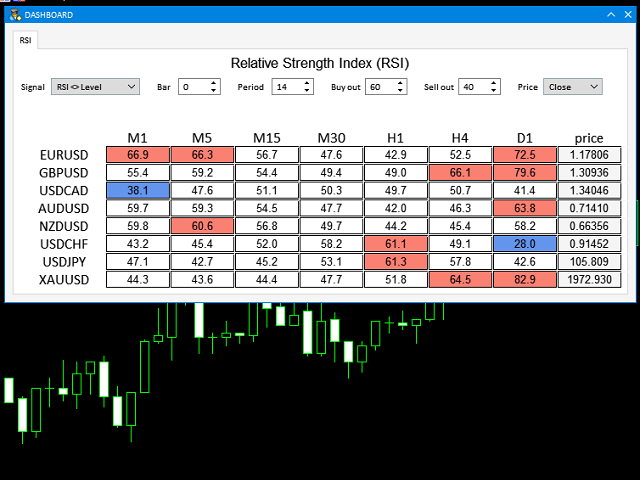
- RSI is upper/lower than level buy out/level sell out .
Work option:
- all symbols added to the "Market Watch";
- only the current character;
- characters from the list.
Colour:
- if the background of the cell is "blue", then this is a buy signal
- if the cell background is "red", then this is a sell signal
Notification about new signal:
- Alert to Terminal
- Print to Terminal
- Push to Mobile app
Parameters:
- type_symbols - selection of a work option: ALL SYMBOLS MARKET WATCH - all symbols from the "Market Watch"; ONLY CURRENT SYMBOL - only the current symbol; INPUT SYMBOLS - symbols from the list;
- input_symbols - a list of symbols to work with (used if the work option is INPUT SYMBOLS);
- RSI_num_bar - number of the used bar for RSI analysis (0 - current);
- RSI_period - period of RSI;
- RSI_buy_out_level - level buy out of RSI;
- RSI_sell_out_level - level sell out of RSI
Dashboards (Meta Trader 4):
- BIG DASHBOARD (all in one)
- Moving Average
- Bollinger Bands
- Envelopes
- MACD
- RSI
- Ichimoku
- Stochastic
- Alligator
- Parabolic SAR
- Momentum
Dashboards (Meta Trader 5):
After use, please write your comment, this will help us make the product better.